Operation
23
4.2.1.3
Analysing Measurement Results
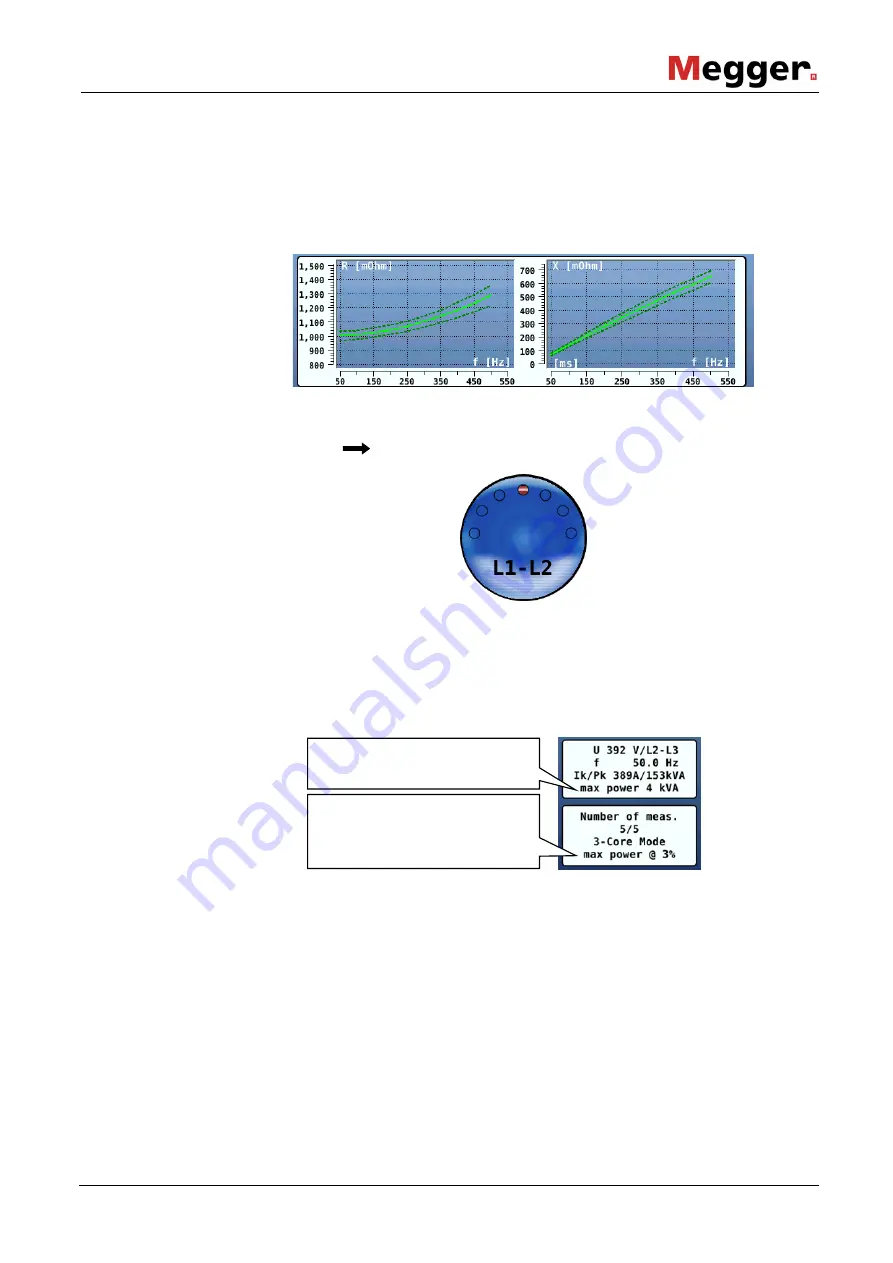
The red curve is hidden on completion of the measurement. Instead, dark-green
envelope curves are marked above and underneath the light-green medium value curve,
these envelope curves represent the upper and lower limit of 99.7% of the measured
values.
To be able to carry out a comparison between the measured conductor combinations in
the case of measuring more than one conductor, the following selection menu must be
called up via the
menu item:
The conductor combination to be displayed is selected by turning the rotary encoder. By
changing the selection, the corresponding curves and measured values are displayed.
In addition to the typical measured values (see previous page), the results of a load
calculation (see page 20) which may have been carried out can be read on the left part
of the display:
Interpretation of the
curves
Toggling the phases
Result of the load
calculation
Result of the load calculation
Physical value to be calculated
@ set requirement
Содержание NIM 1000
Страница 1: ...1 NIM 1000 Net Impedance Meter USER GUIDE Issue 04 06 2016 EN Article number 82941 ...
Страница 2: ...2 ...
Страница 6: ......


