Maxim Integrated
Page 36 of 42
6. By default, the app logs raw data and algorithm results in a .csv file. (Logging may be
disabled by clicking on the three vertical dots in the top right and deselecting the log). The
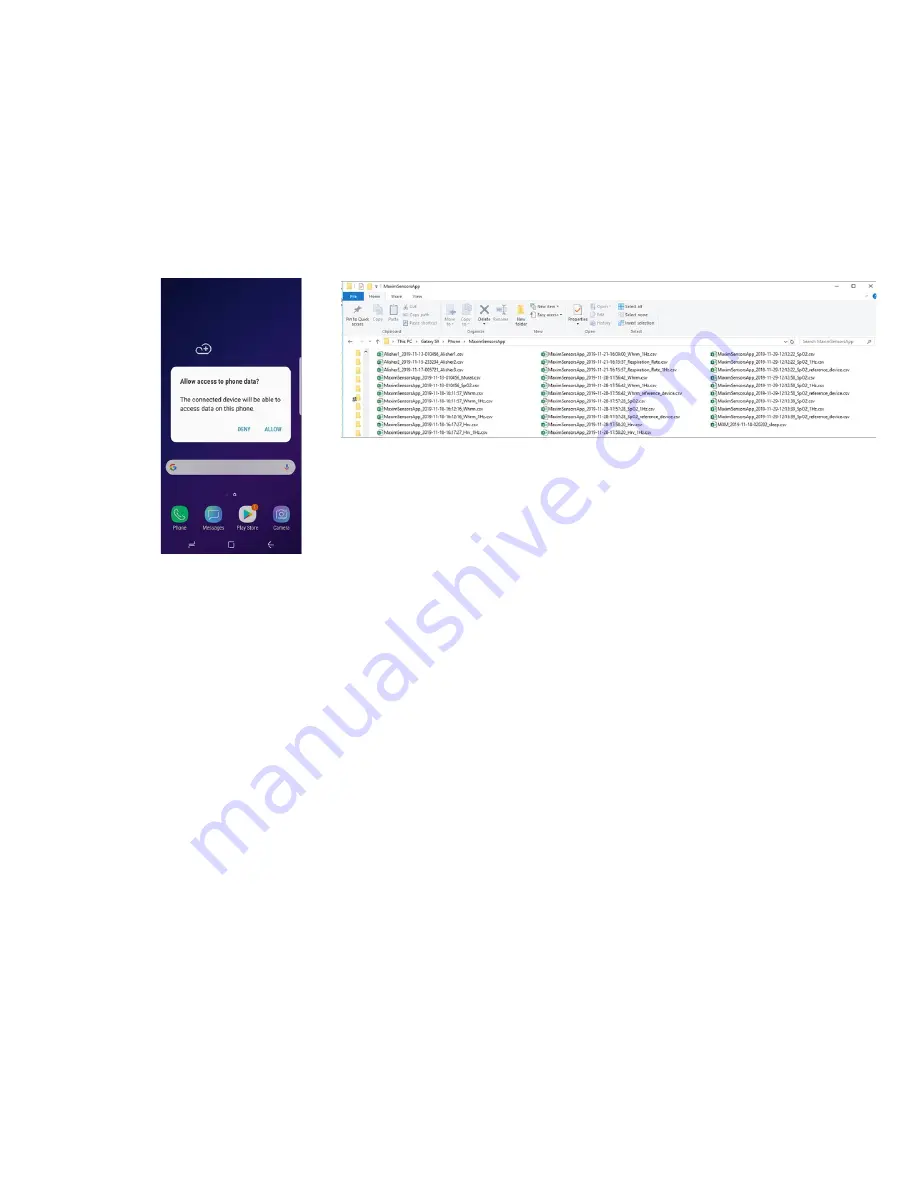
.csv files may be retrieved from Android device using the following steps:
•
Connect an Android device to your PC.
•
Provide proper access when prompted.
•
Browse to the MaximSensorsApp folder and retrieve the related file
(MaximSensorsApp_yyyy-mm-dd-HH:MM:SS_SpO2.csv):
Figure 46. Retrieving the .csv log file from the Android device.
Follow this suggested testing protocol for the most efficient SpO
2
measurement:
•
Subject sits still for three minutes without talking or moving. Placing the arm on top of
a table prevents unexpected wrist movements.
•
Wear and position the health sensor band as described earlier.
•
Connect to either the PC GUI or the Android app as described earlier.
•
Verify that the proper PPG waveforms for IR/Red should are observed without any
noise or artifact.
•
Reference SpO
2
data is recorded throughout the session. Reference SpO
2
can be
recorded visually by reading the reference displayed in the finger clip or using the
Android app.
•
The number of participants should be at least 20 for a meaningful evaluation.
Heart-Rate Variability
1. Click the back button of the Android device to go back to the main menu and click
Heart
Rate Variability
. The individual graphing of the avnn, sdnn, rmssd, or pnn5 data can be
selected by selecting the button of interest and deselecting the other three. For instance,
avnn is selected in Figure 47, and the other measurements are deselected. To start the
heart-rate variability monitoring, click the play icon.


