GXR Series
User Manual
Lynx Pro Audio S.L
11
www.lynxproaudio.com
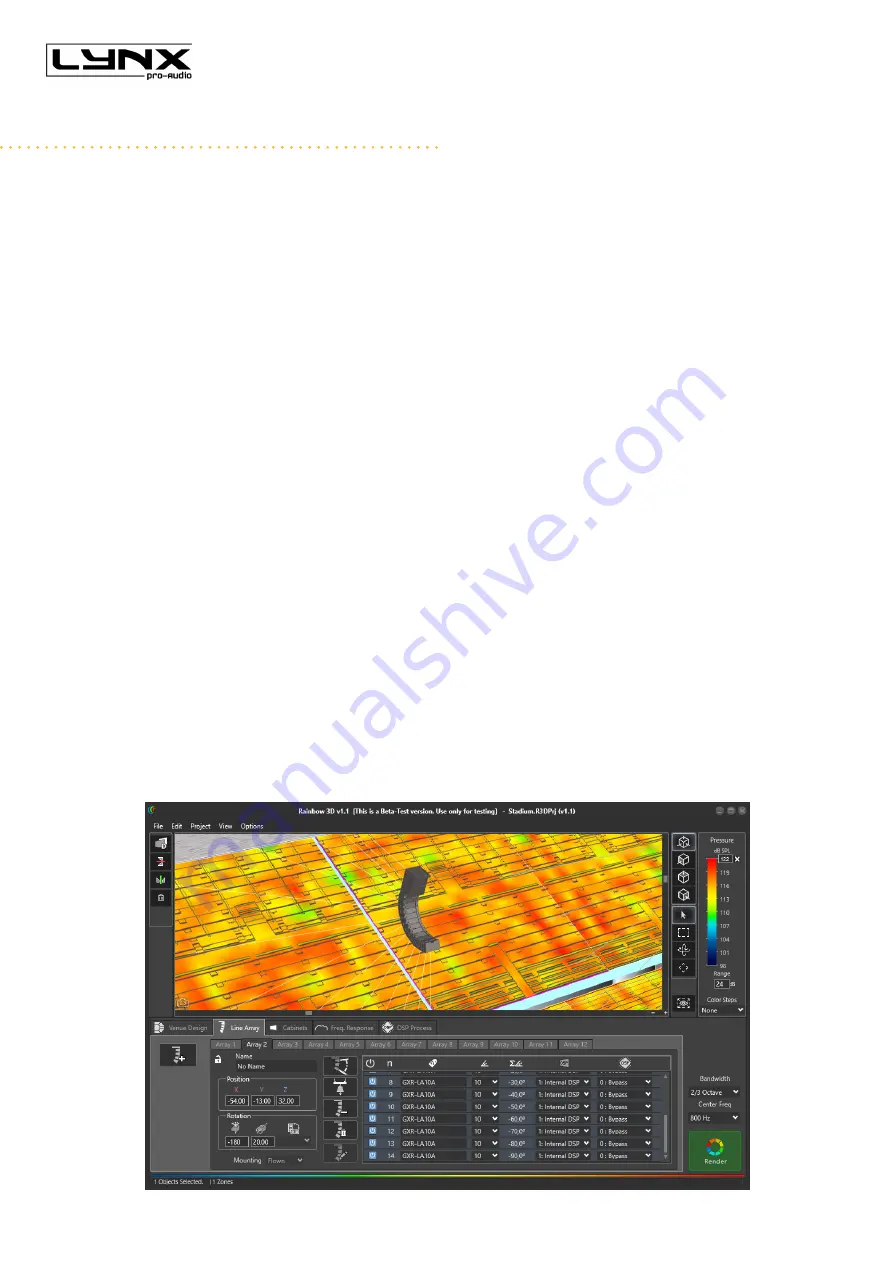
RAINBOW 3D Acoustic Prediction Software
Lynx Pro Audio’s R&D department is working on Rainbow 3D, a new acoustic simulation software with dynamic
3D features. With a sophisticated design, Rainbow 3D stands out for its speed, being able to provide a simulation
in just a few seconds. It also provides algorithms for beam steering and optimizing the listening area.
•
Designed from scratch by professionals
Rainbow 3D has been programmed from scratch by Lynx Pro Audio engineers, using new programming procedures
that achieve an effective simulation with really low calculation time.
•
Multiple listening zones
The program can simulate all Lynx Pro Audio’s acoustic enclosures located in a 3D space, including the classic
side, top and front views. It can also define multiple listening zones and allows offset positioning and symmetry.
Blueprint images, textures and PNG format pictures can be imported.
•
Unlimited sound sources
Allows the acoustic simulation for an unlimited number of sound sources and audio systems. You can place as
many systems (subwoofers, line arrays, columns and individual boxes) as you desire. Also, the line arrays can be
placed in stack or flown configuration.
•
Beam steering
Rainbow 3D has the ability to add DSP processing to the simulation and uses algorithms to control the directivity
(beam steering) in columns, without the need to tilt them physically, being able to divide the column into several
beams that point to different zones.
•
Accurate optimization thanks to FIR filters
Optimized algorithms are used in the listening area to improve the sound coverage and the frequency response. This
feature can be executed in a matter of seconds. Additionally, the export of FIR coefficients can be performed with
the optimization for later loading in the DSP via Ethernet or a USB device. In the near future direct communication
with Lynx Pro Audio and OCS will be available.
•
Multiple measures and tools
Likewise, the R&D department is developing multiple measurement and analysis tools for the calculated data. For
example, the sound pressure curves (SPL) in the listening areas and the capture of virtual measurements that show
the frequency response in the points of location indicated and added. Among other tools you will find autosplay
and a wizard to set up different subwoofer arragements.


