


Lake Shore Model 331 Temperature Controller User’s Manual
Edit Curve (Continued)
The temperature coefficient (positive or negative) of the curve is displayed. The coefficient is
calculated from the first two points of the curve and cannot be changed. Press the
Enter
key.
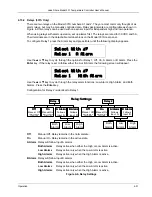
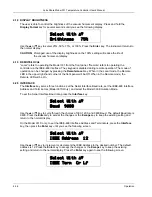
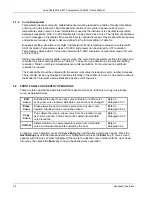
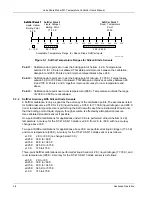
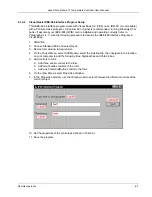
Now that the curve identification parameters are entered, it is time to enter curve breakpoints.
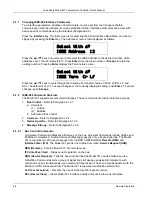
User Curve 21
¾ 0.00000v 00.0000½
The cursor initially blinks on the curve breakpoint number. When the cursor is in this position, use the
s
or
t
key to scroll through the breakpoints in the curve. Press the
Enter
key to modify the current
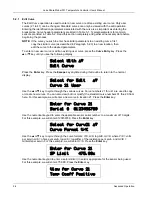
breakpoint. Use the numerical keypad to enter the applicable sensor value. For this example, we will
enter 0.09062 V, then press the
Enter
key. The cursor will jump to the temperature reading. Again
use numerical keypad to enter the applicable temperature in kelvin. For this example, we will enter
475.0 K. Press the
Enter
key.
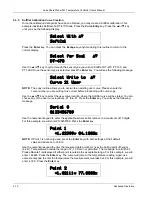
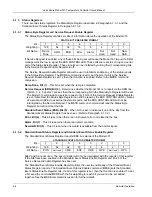
¾ 0.09062v 475.000½
¿ 0.00000v 00.0000½
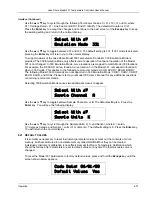
Use the numerical keypad to enter the remaining voltage and temperature points. After entering the
final point in the curve, press the
Enter
key, then the
Escape
key. You will return to the normal
display.
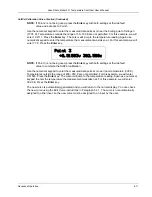
To add a new breakpoint to an existing curve, go to the end of the curve data and enter the new
sensor reading and temperature. Press the
Enter
key, then the
Escape
key. The new point is
automatically put into its proper place in breakpoint sequence.
NOTE:
Typing over an existing reading or temperature will replace that value when you
press the
Enter
key.
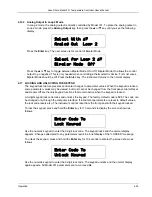
To delete a breakpoint, go to point and enter all zeros for both the sensor reading and temperature.
Press the
Enter
key, then the
Escape
key.
When curve entry is complete, the user must assign the new curve to an input. The Model 331 does
not automatically assign the new curve to either input.
5.2.1.1
Thermocouple Curve Considerations
The following are things to consider when generating thermocouple curves.
•
Users may enter temperature response curves for all types of thermocouples. Enter curve data
in mV/K format with thermocouple voltage in millivolts and temperature in Kelvin.
•
The curve must be normalized to 0 mV at 273.15K (0 °C). Thermocouple voltages in millivolts
are positive when temperature is above that point and negative when temperature is below that
point.
•
To convert curves published in Celsius to Kelvin, add 273.15 to the temperature in Celsius.
•
The temperature range for some thermocouple types may extend below 1 K or above 1000 K.
•
The input voltage of the 331 is limited to ±50 mV, so any part of the curve that extends beyond
±50 mV is not usable by the instrument.
•
A message of S-OVER or S-UNDER on the display indicates that the measured thermocouple
input is over or under the ±50 mV range.
Advanced Operation
5-5


