a. From the normal display mode, press and release the “OUT/+” key once to view
the outdoor maximum temperature and humidity (“MAX” will be displayed above
the outdoor temperature and humidity).
b. Press and release the “OUT/+” key again to view the outdoor minimum tempera-
ture and humidity.
c. Press and release the “OUT/+” key again to return to the normal mode (timeout
of viewing minimum/maximum values will occur if no keys are pressed for fifteen
seconds).
d.
Note:
To reset the outdoor minimum and maximum temperature and humidity,
first display the values you wish to reset (minimum or maximum). Next press and
hold the “SET” key for at least three seconds. You will see then that the values
will reset to the current temperature and humidity and corresponding time.
D. Multiple Remote Temperature Sensors
The WS-9032U is able to receive signals from 3 different remote sensors. These
extra remote sensors can be purchased through the same dealer as this unit. A
TX4U will monitor the temperature and humidity, a TX3U will monitor temperature
and display the temperature on its LCD, a TX3UP will monitor the temperature via a
probe for measuring soil or water temperatures and a TX6U will monitor the tem-
perature only.
Note:
When setting up multiple units it is important to insert batteries first into all the
remote sensors, and in numeric sequence. Second install batteries into the indoor
weather station. Transmission problems will arise if this is not done correctly and if
the total time for set-up exceeds 6 minutes
1. Set Up of Multiple Units
a. It is necessary to remove the batteries from all units currently in operation.
b. Remove the battery covers to all remote sensors.
c. Place all remote sensors in a numeric sequential order.
d. In sequential order, install batteries following the same battery installation proce-
dures seen in Detailed Set-Up Guide section of this manual.
e. Install batteries into the indoor weather station.
f. Follow the Detailed Set-Up Guide for programming and operating instructions.
2. Viewing and Operating with Multiple Remote Sensors
a. To view the temperature of a different remote sensor press and release either of
the “SNOOZE/CH” buttons. A shift from one “boxed” number to the next should
be observed in the OUTDOOR LCD.
b. The minimum and maximum temperature of the additional remote sensor can be
displayed by pressing the “OUT/+” button.
c. To reset the minimum and maximum temperature readings press and hold the
“SET” button for 3 seconds and that temperature/humidity record for that remote
sensor will be reset only.
Each remote sensor will have its own minimum and maximum values stored.
E. Comfort Indicator for Indoor Temperature and Humidity
1. The comfort level indicator appears inbetween the indoor tempearture and
humidity.
2. The indicator will display a “happy-face” when the temperature is between 68˚F
and 79˚F (20˚C and 25.9˚C), and the humidity is between 45% and 64%.
3. A “sad-face” will be displayed when the temperature and humidity are outside the
mentioned ranges.
F. Weather Forecast Icon and Pressure Trend Indicators
The weather forecasting feature is estimated to be 75% accurate, and is based solely
upon the change of air pressure over time. The WS-9032U averages past air-pres-
sure readings to provide an accurate forecast-creating a necessity to disregard all
weather forecasting for 12-24 hours after the unit has been set-up, reset, or moved
from one altitude to another (i.e. from one floor of a building to another floor). In
areas where the weather is not affected by the change of air pressure, this feature
will be less accurate.
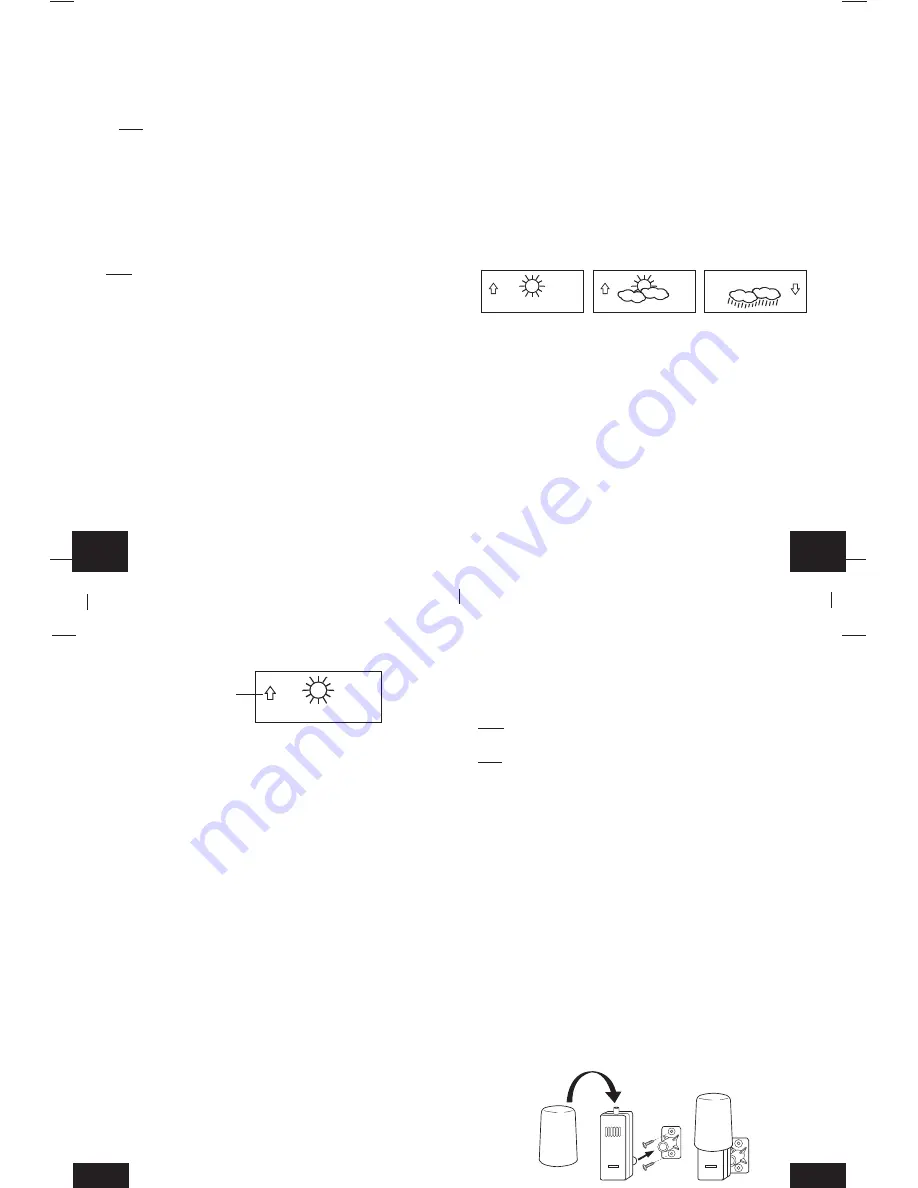
1. Weather Icons
a. There are 3 possible weather icons that will be displayed at various times in the
center of the indoor weather station.
i
Sunny-indicates that the weather is expected to improve (not that the weather
will be sunny).
ii
Sun with Clouds-indicates that the weather is expected to be fair (not that the
weather will be sunny with clouds).
iii Clouds with Rain-indicates that the weather is expected to get worse (not that
the weather will be rainy).
b. The weather icons change when the unit detects a change in air pressure.
c. The icons change in order, from “sunny” to “sun with clouds” to “clouds with rain”
or the reverse.
d. It will not change from “sunny” directly to “clouds with rain”, although it is possible
for the change to occur quickly.
e. If the symbols do not change, the weather has not changed (or the change has
been slow and gradual).
f. The sensitivity of the change in foreacst icon is set by the user in section F of the
Detailed Set Up Guide.
G. Weather Tendency Arrows
1. Along with the forecast icon there is a pressure tendency arrow.
2. There is one that points up (on the left side of the LCD) and one that points down
(on the right side of the LCD).
3. These arrows reflect current changes in the air pressure.
4. An arrow pointing up indicates that the air pressure is increasing and the weather
is expected to improve or remain good.
5. An arrow pointing down indicates that the air pressure is decreasing and the
weather is expected to become worse or remain poor.
6. No arrow means the pressure is stable.
7. A storm can be expected if there is a drop of 4 hPa or more in less than 6 hours.
The clouds with rain icon will be displayed and the tendency arrow that points
down will be flashing-indicating the storm warning feature has been activated.
The flashing will stop when the air pressure stabilizes or begins to rise.
H. Barometric Air Pressure Reading
1. The actual barometric air pressure is displayed directly under the weather fore-
cast icon
2. The relative air pressure is calibrated by the user through the programming mode.
3. Please Follow the programming instructions in section F of the Detailed Set Up
Guide to set this feature.
I. Air Pressure History Bar Chart
1. The bar graph shows in hPa (Hekto Pascal) the recorded air pressure over the
past 24-hours.
2. The horizontal axis shows the hours at increments of -24 hours, -18 hours, -12
hours, -9 hours, -6 hours, -3 hours, and 0 hours (current).
3. The vertical axis is set by hPa: the “0” on this axis represents the current hPa,
and + or - 1,3,5, or 7 shows (in hPa) how high or low the past air pressure was as
compared to the current one.
4. The “0” on the vertical axis indicates the current air pressure value.
5. The “0h” on the horizontal axis indicates the current hour, thus the current air
pressure also.
6. Each bar on the bar graph represents a value of 0.03 hPa, and each bar also has
a corresponding value on the verticle axis.
7. Air pressure trends can be determined by simply glancing at the bar graph.
a. If the bars are rising (higher on the right than the left) then the air pressure has
a rising trend, and the weather should improve.
b. If the bars are dropping (lower on the right than the left) then the air pressure
has a falling trend, and the weather should worsen.
8. Multiply the two values to find past air pressure (note the + or - sign of values on
the verticle axis); i.e. 0.03 hPa x 3 = 0.09 hPa, now add this value to the air
pressure (in LCD 4) to evaluate what past air pressures have been.
9. The bar chart will constantly scroll to avoid burnout of the LCD.
Note:
This feature cannot be turned off.
MOUNTING
Note:
Before permanently mounting, ensure that the indoor weather station is able
to receive signals from the transmitters and WWVB signal at the desired location. To
achieve a true temperature reading, avoid mounting the remote thermo/hygro sen-
sor (or any sensor) where direct sunlight can reach the remote sensor. We recom-
mend that you mount the remote sensor on a North-facing wall or under an eve. The
sending range of the remote thermo/hygro sensor is 330-ft (100m) however obstacles
such as walls, concrete, and large metal objects can reduce the range. Place all
units in their desired location, and wait approximately 15 minutes before perma-
nently mounting to ensure that there is proper reception. If the indoor weather sta-
tion loses the signal from the remote sensor, it will display the last temperature read-
ing for 15 minutes. After 15 minutes of not receiving any signals, the remote tem-
perature will display “- -.-”.
A. Mounting the Remote Thermo/hygro Sensor
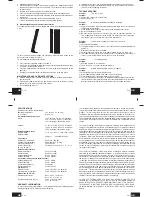
The remote thermo/hygro sensor can be mounted with the use of screws or by using
the adhesive tape.
1. Mounting with screws
a. Remove the mounting bracket/receptor from the packaging.
b. Place the mounting bracket over the desired mounting surface.
c. Through the 2 screw holes of the bracket, mark the mounting surface with a
pencil.
d. Where marked, start the screw holes using the provided screws.
e. Remove screws from the mounting surface.
f. Align the mounting bracket with the started screw holes.
g. Screw mounting bracket onto the mounting surface. The screws should be flush
with the bracket.
h. Fit the mounting post (on the back of the transmitter) into the receptor of the
mounting bracket.
GB
P.14
GB
P.15
GB
P.16
GB
P.17
Pressure trend arrow
REMOTE
THERMO-SENSOR
433 MHz
REMOTE
THERMO-SENSOR
433 MHz


