Sunny
Partly Cloudy
Clouds
Rain
T-Storm
Snow
5
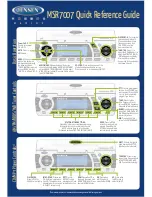
Press and release the
SNOOZE/LIGHT
button to adjust the backlight
intensity:
High - Low - Off
Adjustable Backlight
24-hour Pressure History Graph
•
The bar graph indicates your pressure history
trend over the past 24-hours.
•
The far right “0h” is current pressure.
•
Read the graph from left to right to view past to
current pressure.
•
When the bars are rising, weather should
improve.
•
When the bars are falling, weather may worsen.
Animated Forecast Icons
•
The forecast icons use the station’s internal barometer to predict
conditions to come within the next 12 hours. For more info, watch our
video here:
•
The Snow Icon will show when temperatures are below 32°F (0°C) and
rain or T-storms are predicted.