SiPM Evaluation Kit Quick Start Guide
SiPM
Eval Kit
3 Single Photon Measurements
3.1 Dark Count Spectrum
•
At the oscilloscope, set the trigger to the amplified SiPM signal at 0.5 pe amplitude (1 pe is the smallest
occurring pulse height, corresponding to a photoelectron pe).
•
Note:
This measurement has to be done under dark conditions without illuminating the SiPM.
•
Measure the area respectively the charge of the signal at the position of the trigger point in e.g. a 25 ns
wide gate. Best results are obtained by integrating the whole positive pulse area.
•
Histogramming of the integrated charge is the resulting dark count spectrum.
•
Note:
E.g. crosstalk probability can be extracted from the dark count spectrum.
3.2 Single Photon Spectrum
•
For this measurement, a pulsed light source is needed. This can be e.g. a pulsed LED or a pulsed laser.
Connect the electrical trigger output of the pulser to the oscilloscope and set the trigger to it.
•
Note:
In case a synchronized electrical trigger output is not provided by the pulser, a second SiPM Evaluation
Kit can be used to generate the trigger signal. This second SiPM should be fully illuminated by the same optical
pulse e.g. with an optical beam splitter. The other path for the single photon measurement can be attenuate
e.g. with neutral density filters.
•
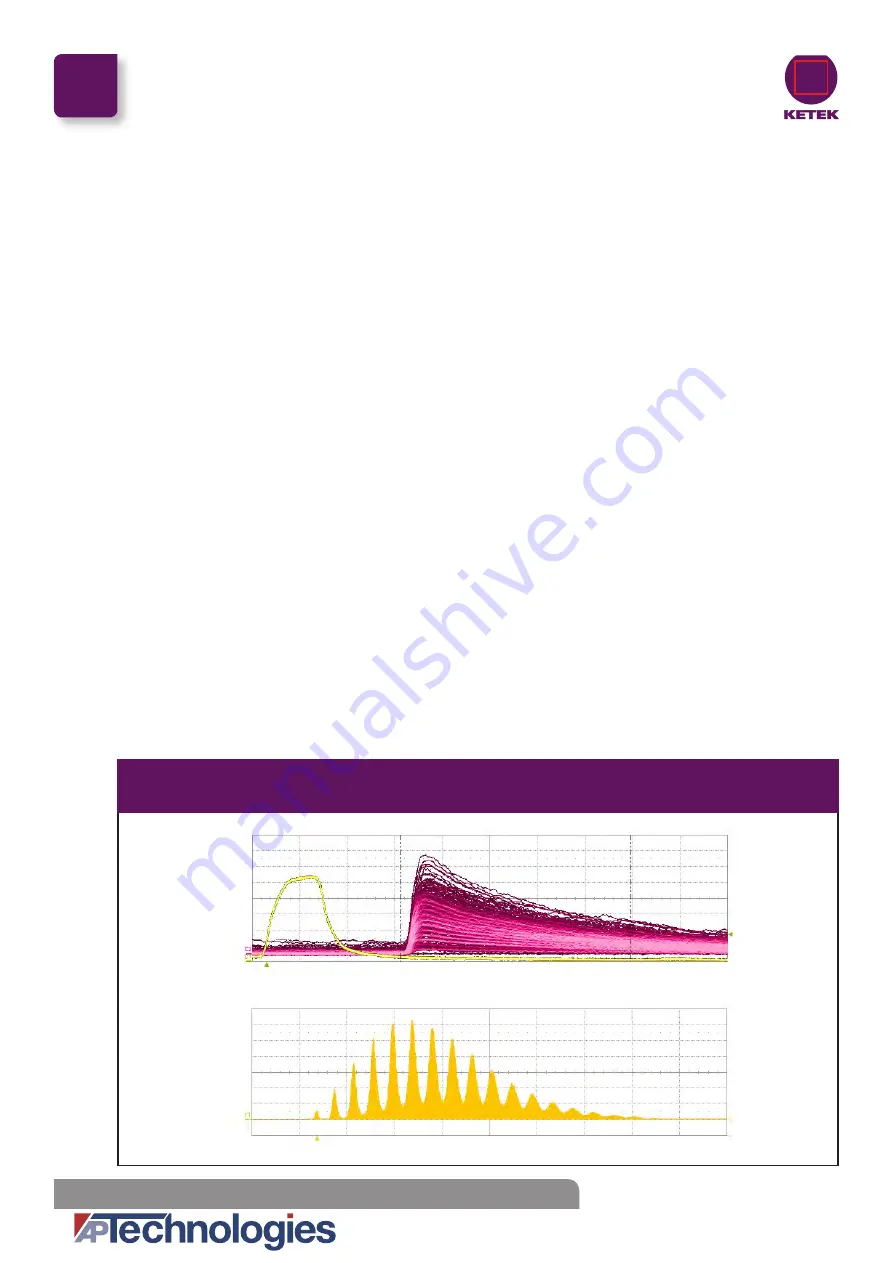
Measure the area respectively the charge of the SiPM signal in e.g. a 25 ns wide gate. The histogram of
the measured charge is the single photon spectrum (cf. fig. 2).
•
Note:
E.g. the relative gain, breakdown voltage and photo detection efficiency can be extracted.
3.3 Using the Full Dynamic Range
•
The amplified SiPM signal output and the Monitor output can be connected and used simultaneously.
Typically for low light levels down to single photons, the measurement is done with the amplified out
-
put. For higher light levels, the preamplifier will saturate at 0.5 V signal amplitude. After this point, the
Monitor output is measured. This allows to exploit the the full dynamic range of the SiPM.
Fig. 2 Example of a Single Photon Spectrum
Measured with PM3350 at 4 V overvoltage
SiPM Signal
Histogram
Laser Trigger
SiPM Signal
20 mV
/div
Coun
ts [a.u.]
5 ns/div
Integrated Charge [nVs]
End In
tegr
ation Ga
te
St
art In
tegr
ation Ga
te
pedes
tal
1 pe
2 pe
3 pe
4 pe
5 pe
6 pe
7 pe
8 pe
9 pe
10 pe
11 pe
12 pe
13 pe
14 pe
15 pe
16 pe
17 pe
www.aptechnologies.co.uk
AP
Technologies Limited The Coach House Watery Lane Bath BA2 1RL
T: +44 (0) 1225 780400 F: +44 (0) 8701 266449 E: [email protected]

