


©2016 IQtronic technologies Europe, s.r.o.
Page 8 of 22
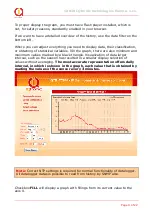
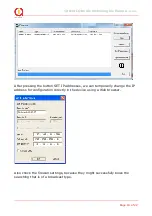
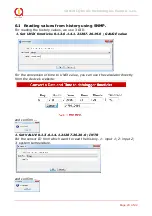
Clicking on rectangles of output statuses - red/green color indicates the status
of outputs - on / off, it is possible to change this state to the opposite. With
each change, the counter will increase by one.
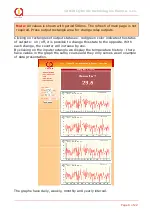
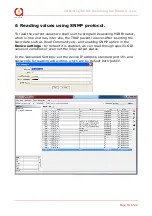
By clicking on the inputs rectangle we display the temperature history - there
have values in the graph the same course and they only serves as an example
of data presentation.
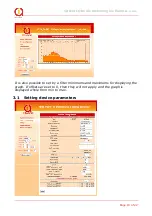
The graphs have daily, weekly, monthly and yearly interval.
Note:
All values is shown with period 500ms. The refresh of main page is not
required. Press output rectangle area for change relay outputs.


