Cub Instrument User Manual V2.4
Unrivalled Gas Detect
ion.
Page 21 of 46
ionscience.com
The
Datalog
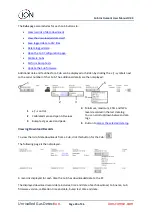
column displays the time and date of the start of each data log and a button for
To view additional log details, click
+
at the beginning of its row. The
Calibration
column then
displays the zero and span levels that the Cub was calibrated to at the time and the
Datalog
column
displays the minimum and maximum detected gas levels, and the detected STEL and TWA levels.
The
Datalog
column also displays an additional button
for viewing details of the logged data
Viewing Details of Logged Data
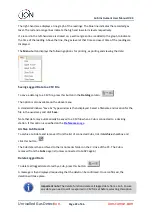
To view details of a data log, press this button in the
Datalog
column:
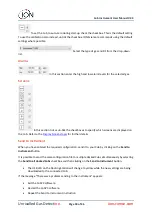
To view details of the most recent data log recorded by a Cub, press the same button on the
Cubs
page for that Cub. The number on the button indicates how many files are stored within the Cub.
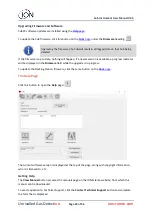
The details of the reading recorded in the selected log are then displayed. For example:
The top area displays the general details of the log and of how the Cub was configured at the time.
The left-hand area lists the time and gas level of each reading. Red values indicate that the reading
has triggered a high level alarm, orange values that the reading has triggered a low level alarm.


