


42
www.idealnetworks.net
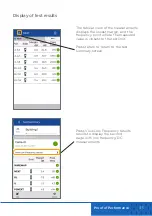
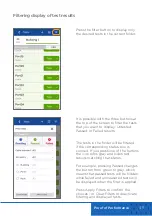
Press “View Low Frequency results” to
display the measurements not present
on the first page.
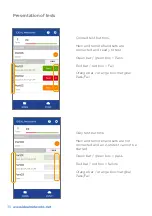
The measurements appear with the
representation of the main or remote
handset to indicate which side the link
has the worst value or fault.
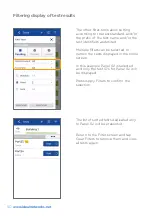
Scroll down to see the full list on the
first page.
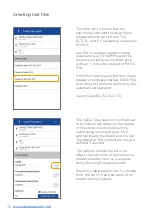
The wiremap is always at the top
of the list because it is a common
failure mode, unless there is a failed
measurement.
You can re-run the test or edit it
(to rename it for example) with the
buttons at the bottom of the screen.
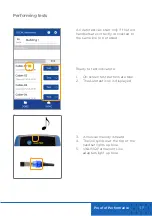
Tap a measurement from the summary
screen to open the detailed view of the
results.
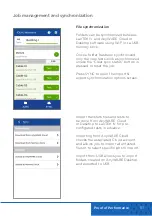
Switch between graphical or tabular
view.
Graphic display options.
Switch between main and receiver
handset view
Select the pairs to display on the plot.
Display of test results