www.icaretonometer.com
26
Icare HOME
Icare HOME tonometer Instruction manual for health care professionals
English
Table 3 provides the limits of agreement between the HOME tonometer and the two
reference tonometers. All ANSI performance goals were met as less than 5% of
measurements fell outside ± 5 mmHg at each pressure range and less than 1% fell
outside ± 7.5 mmHg at each pressure range.
Table 3. Limits of Agreement between Home and Reference Effectiveness Analysis
Cohort.
N is the number of eyes with measurements from both devices.
Difference = HOME - Reference. 95% confidence interval (CI) for mean difference is based on t-distribution.
95% limits of agreement (LOA) = mean difference ± 2 difference SD.
% = (n / N) x 100.
The first HOME IOP measurement of each study eye was used in the analysis.
Mean/Median: the median was used if the eye had three measurements. Otherwise, the mean was used if the eye had
two measurements.
www.icaretonometer.com
27
Icare HOME
Icare HOME tonometer Instruction manual for health care professionals
English
CCT
Home
GAT
Difference
95% CI for
Mean
95% LOA for
Mean
Outside
± 5 mmHg
Outside
± 7.5 mmHg
Group
N
Mean (SD) Mean (SD)
Mean (SD)
Difference
Difference
n (%)
n (%)
500-520
94
17.43
(5.70)
18.01
(5.28)
-0.59
(2.46)
-1.09, -0.08
-5.50, 4.33
3
(3.2%)
0
(0.0%)
521-540
100
16.52
(6.50)
16.87
(5.99)
-0.)35
(2.03)
-0.75, 0.06
-4.40, 3.71
1
(1.0%)
0
(0.0%)
541-560
95
17.98
(6.55)
18.28
(5.93)
-0.)30
(2.59)
-0.83, 0.23
-5.47, 4.87
3
(3.2%)
0
(0.0%)
561-580
57
17.70
(5.53)
18.61
(4.72)
0.)91
-
(2.86)
-1.67, -0.15
-6.64, 4.81
4
(7.0%)
1
(1.8%)
581-600
30
18.33
(4.03)
19.25
(3.87)
-0.)92
(2.22)
-1.75, -0.09
-5.36, 3.53
1
(3.3%)
0
(0.0%)
Overall
376
17.44
(6.01)
17.96
(5.50)
-0.)53
(2.43
)
-0.77, -0.28
-5.39, 4.34
12
(3.2%)
1
(0.3%)
N is the number of eyes with measurements from both devices. Difference = HOME - Reference. 95% confidence interval
(CI) for mean difference is based on t-distribution. 95% limits of agreement (LOA) = mean difference ± 2
difference SD. %
= n
N
100. The first HOME IOP measurement of each study eye was used in the analysis. The Mean/Median of GAT
was used in the analysis: the median was used if the eye had three measurements. Otherwise, the mean was used if the
eye had two measurements.
Precision:
Table 5 provides the repeatability analyses for all measurements in the
effectiveness analysis cohort. The HOME CV% was comparable for the low and medium
IOP range (~10% for each bin) and smaller for the high IOP range (~7.5%).
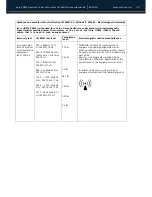
Table 4 provides the limits of agreement between Icare HOME and GAT by
central corneal thickness. Icare HOME slightly underestimates IOP compared to GAT over
the corneal thickness range 500-600 μm.
Table 4. Limits of Agreement between HOME and GAT by Central Corneal Thickness (CCT)
Effective Analysis
Table 5. Repeatability - All Measurements of Effectiveness Analysis Cohort
All statistics are estimated from a random-effect model with study eye and error as the random effect. Mean =
Intercept of the ANOVA model. Repeatability SD = Square root of the residual variance. Repeatability limit = 2.8 x
Repeatability SD.
Icare HOME tonometer Instruction manual for health care professionals
ENGLISH
26
www.icare-usa.com


