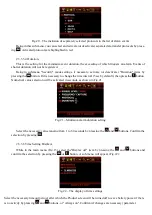
the right part of the graph, while the values are moving to the left, becoming obsolete.
Thus,
graphs show the changing of the radio environment over time
. These graphs are the main means
used to search for "spy bugs" via the visual assessment of the signal level and its change as the Product ap-
proaches/moves away from the transmission source.
Notification: Peak value graph (item 1) illustrates the
impulse component
and it is an equivalent of "im-
pulse" mode of searching devices (digital "bug" search mode). Average value graph (item 2) illustrates the
constant component and the realization of the "analog" mode (analog "bug" search mode). You can search
for the local maximum signal strength using any of these two graphs considering that the "impulse" mode,
i.e. peak value graph, is better when searching for digital "bugs".
Furthermore, there is additional information on the screen, which can be useful when searching for trans-
mitting devices:
- item 3 – frequency value for a steady periodic signal or designation of an identified data transfer protocol
(cl.
2.3.2.2.2
Frequency (protocol) indication);
- item 4 (Е) – current values of peak and average signal strength in dB regarding zero;
- item 5 (Z) – stored values of zero level for peak and average radio signal strength (cl.
2.3.2.2.8 Subtracting
background
).
On the right part of the screen, the scales for adjusting the sensitivity (item 6) and the selection of the
vibration engagement threshold are displayed (item 7) (cl.
2.3.2.2.3
Sensitivity and vibrate-mode indication
engagement threshold adjustment).
In the top line of the screen icons of settings and product status are located:
- items 8, 14 – selected measurement channel (cl.
2.3.2.2.5 Measurement channel selection
);
- item 9 – battery level;
- item 10 – current operating mode;
- item 11 – current time;
- item 12 – volume level;
- item 13 – vibrate-mode indication status (on or off).
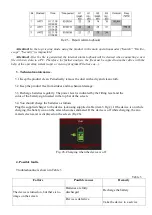
2.3.2.2.2
Frequency (protocol) indication
The device provides an indication of the signal stable in time and also identifies and displays the most
common digital data transmitting standards such as
GSM, DECT, Bluetooth, WLAN and 3G/4G (item 3
Fig.8).
Designations
-
cell phones and GSM radio modules, data transmitting via
GPRS, EDGE;
-
cell phones and DECT radio modules
;
- DECT BASE (
DECT base stations
);
-
Bluetooth radio modules
;
-
wireless networks such as Wi
-Fi, Zigbee, LoRA
etc;
-
cell phones and radio modules
, working in data transfer mode on technology UMTS,
CDMA, LTE.
Note.
In case several different standard sources are operating simultaneously, the identification can be difficult, as
only one protocol can be displayed on the screen at the moment. It is recommended to turn off all known radio


