background image


HT155 - HT157 


EN - 23

 Line 1 

 Lines 2-7 

 Line 8 

 Line 9 

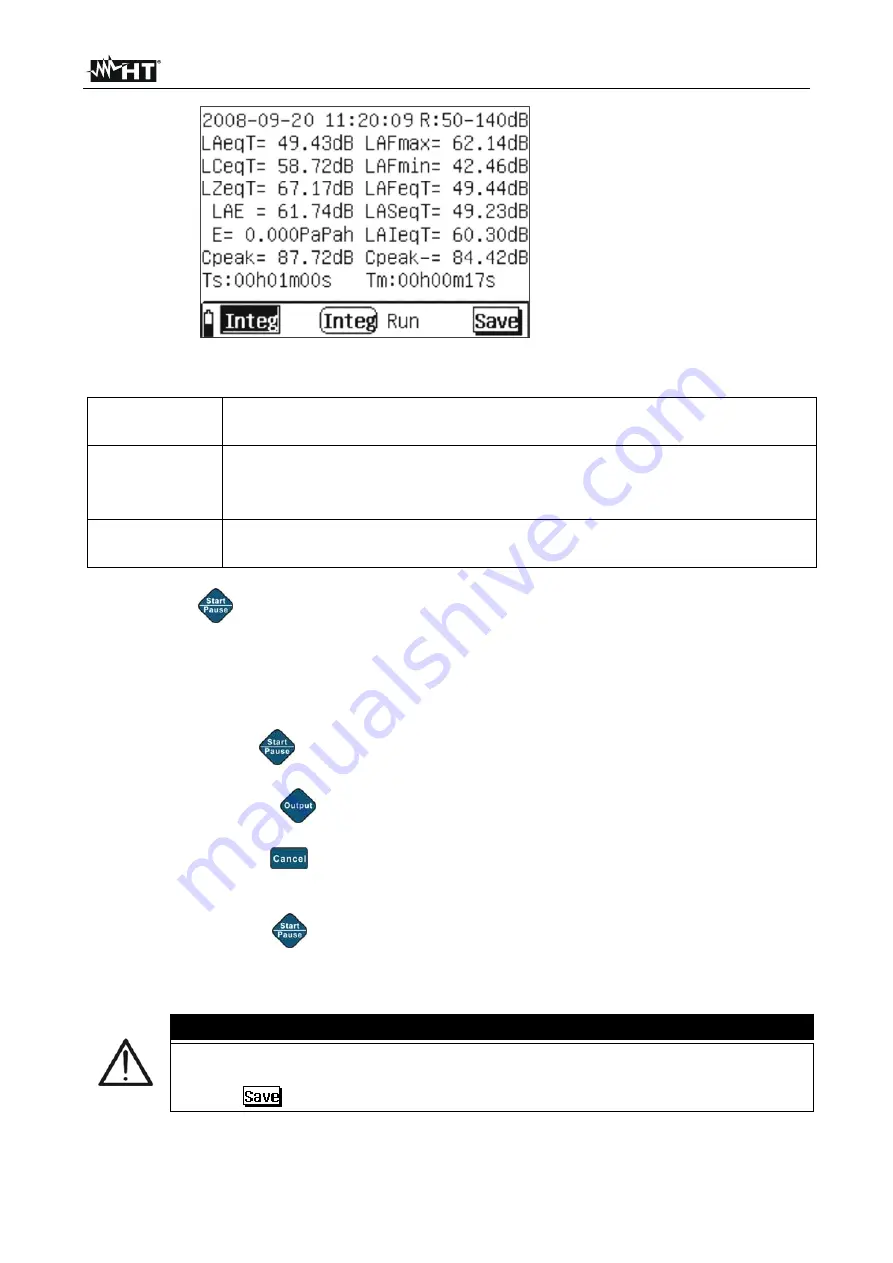
Fig. 21: Screen of integrated values of Integral analysis 


Line 1 

It allows setting the current date/time and the measuring range in the 
same way as for the instant value display 

Lines 2- 7 

These lines show in real time the values of the following quantities 
integrated by the instrument: LAeqT, LCeqT, LZeqT, LAFmax, LAFmin, 
LAFeqT, LASeqT, LAIeqT, LAE, E, Cpeak+, Cpeak-
 

Line 8 

In this line, the left part shows the duration of the “Ts” measure set in the 
programming menu (see § 4.6.2) and the measuring time “Tm” 


5.  Press the “

” key to start the integration measurement. The instrument automatically 

shows the screen with the integrated values (see Fig. 21) and the “Run” message 
appears on the display 

6.  When the instrument reaches the measuring time (Tm = Ts), the instrument stops the 

integration measurement and the “End” message appears on the display. Data are 
automatically saved in the instrument’s memory
 

7. By pressing the “

” key while a process is in progress, the instrument pauses 

measurement and the “Pause” message appears on the display. In this situation: 

 By pressing the “

” key, the instrument stops measuring, shows the “Finish” 

message on the display and automatically saves the data up to that instant 

 By pressing the “

” key, the measurement in progress is automatically cancelled 

and the instrument goes back to the waiting condition, showing the “Ready” 
message on the display 

 By pressing the “

” key again, the measurement starts again from the instant in 

which it was stopped and the “Run” message appears on the display again 


CAUTION 


  While a measurement is in progress (Run), it is not possible to access the 

programming menu and it is necessary to first complete or stop it 

 The 

” icon cannot be used for data integration measurement 


Содержание HT155

Страница 1: ... Copyright HT ITALIA 2011 Release EN 1 02 28 12 2011 HT155 HT157 User manual ...

Страница 2: ......

Страница 3: ...ve band HT157 only 24 5 2 1 Initial operations 24 5 2 2 Octave band analysis 1 1 25 5 2 2 1 Operations for sections LIST GRAPH and TOTAL 25 5 2 3 Analysis in third octave band 1 3 30 5 2 3 1 Operations for sections LIST GRAPH 30 5 2 3 2 Operations in TOTAL section 33 6 INSTRUMENT ACOUSTIC CALIBRATION 35 6 1 1 Foreword 35 6 1 2 Preliminary operations 35 6 1 3 Acoustic calibration with calibrator HT...

Страница 4: ...End of life 55 10 TECHNICAL SPECIFICATIONS 56 10 1 Technical specifications 56 10 2 Statistic analisys chararcteristics 57 10 3 Characteristics of analysis in 1 1 and 1 3 octave band HT157 only 57 10 4 Characteritics of portable calibrator HT151 57 10 5 General characteristics 58 10 6 Accessories 58 11 SERVICE 59 11 1 Warranty conditions 59 11 2 Service 59 12 APPENDIXES 60 12 1 Appendix 1 Frequenc...

Страница 5: ... the EC mark 1 1 PRELIMINARY INSTRUCTIONS CAUTION The instrument has been designed for measuring sound pressure levels SPL from 25dB to 140dB with frequency ranging from 10Hz to 20kHz We recommend following the usual safety rules to protect the instrument against improper use After a long storage period or if the instrument has been used under critical conditions recalibrating the instrument is re...

Страница 6: ...aving measures and recordings AC analogue output for connection to external dataloggers USB interface for connection to PC and or USB pen drive Wide backlit LCD display The front panel of the instrument bears the function keys for the selection of the above listed functions see chapter 4 2 The measured value appears on the wide LCD display with the indication of the measuring unit and of the enabl...

Страница 7: ...tteries are almost flat the symbol appears on the display further to the indication BATTERY LOW To replace the batteries follow the instructions given in 9 2 The instrument may be supplied also by means of the provided external DC 5V supply connected to the USB interface It is not necessary to remove the internal battery when the external power supply is connected The instrument is provided with a...

Страница 8: ...TER key 8 EXIT key 9 OUTPUT key 10 START PAUSE key 11 Arrow key for programming 12 Arrow key for programming 13 Arrow key for programming 14 Arrow key for programming 15 SETUP key for programming Fig 1 Description of the instrument s front panel 4 1 2 OUTPUT INTERFACE LEGEND 1 AC analogue output 2 RS 232 interface not active 3 Mini USB interface Fig 2 Description of the output interface ...

Страница 9: ...ing the display contrast The SETUP key allows rapidly accessing the programming menu without passing from the main menu when a measurement is in progress 4 3 ANALOGUE OUTPUT DESCRIPTION The instrument is provided with an AC voltage analogue output proportional to the input signal measured in dB which can be used to connect a 3 5mm output jack with the characteristics shown in Fig 3 Fig 3 Descripti...

Страница 10: ...sible measuring modes are listed is shown on the display Use the keys and for selecting and confirm with If no key is pressed within 5s the instrument automatically sets itself to the last mode used Pressing the key when measuring automatically resets the system and brings the instrument back to the initial selection menu Press the key to turn off the instrument With the instrument turned off the ...

Страница 11: ...uently recalling them each time it is turned on CAUTION It is not possible to access the Setup section while the instrument is recording Fig 5 Selection of the instrument s SETUP section 4 6 2 PROGRAMMING MENU INTERFACE Select the Setup section in the main menu and confirm with The instrument displays the screen shown in Fig 6 Line 1 Line 2 Line 3 Line 4 Line 5 Line 6 Line 7 Line 8 Fig 6 Internal ...

Страница 12: ...en the key is pressed Option Yes before starting measuring the instrument accesses the Setup section when the key is pressed so that the parameters can be checked and or changed When the key is pressed the instrument starts measuring This option is not available for the 24Hours operating mode Line 5 In this line it is possible to select by means of the and keys a delay time max 10s for the activat...

Страница 13: ... memory location used for saving the measure name The second column Name indicates the saved name associated to the relevant location CAUTION The instrument is capable of saving up to 256 measure names If this reference is exceeded it automatically deletes all 256 names already created only saving the last input name To create a new measure name proceed as follows 1 Select Line 2 inside the progra...

Страница 14: ...x 14 characters available 4 Press the key to save the created measure name which will be automatically present in Line 2 of the programming menu further to the number of the location assigned to it 5 Press the key to exit the programming menu CAUTION For a more rapid creation of the measure names we recommend using the provided software and to subsequently send these elements to the instrument con...

Страница 15: ...he statistic analysis consisting of 6 icons on the display 3 Select the relevant icon and press to enter the specific menu In detail Statistic the instrument measures the sound pressure level with weighting A with time constant Fast and equivalent noise level 24 Hours measurement of the sound pressure level in a fixed time period of 24 hours Integral the instrument integrates the sound pressure le...

Страница 16: ... and keys to select the desired program Configuration of the measuring range 1 Use the and keys to move the flashing cursor to symbol R 2 Use the and keys to select the measuring range among the following options 0 90dB 10 100dB 20 110dB 30 120dB 40 130dB 50 140dB according to the reading carried out by the instrument After each range modification the reading takes approximately 3s to become stabl...

Страница 17: ...ed in the programming menu see 4 6 The instrument displays the following screen Fig 12 Statistic analysis activation 3 The Run message appears in the lower part of the instrument to indicate that a recording is currently in progress In this condition the indication of the measuring range disappears and the measuring time appears and cannot be changed while recording 4 By pressing the key while rec...

Страница 18: ...the values measured within the 40 139dB range 9 Press the key to pass from the statistic distribution diagram to the cumulative distribution diagram Accumulation which shows each statistic level of the noise 10 In the graphical screens it is always possible to pause and or stop recording in the same way as with numerical display which it is always possible to go back to by pressing the or keys wit...

Страница 19: ...rtain duration measuring time from the same second of each hour during a whole day CAUTION The measuring time within each interval can be set see 4 6 2 in a range of 1min 59min For a measuring time different from this range the instrument automatically considers a time of 20min 1 Use the keys or to select the 24Hours icon see Fig 14 and confirm with Fig 14 Selection of 24Hours analysis 2 The instr...

Страница 20: ... pressing the or keys the instrument shows the following quantities in a horizontal line LAeqT Lmax Lmin L5 L10 L50 L90 L95 SD LAFeq corresponding to the statistic analysis of the sound pressure level with frequency weighting A and time constant F Lines 3 8 These lines show in real time the values of the quantities integrated by the instrument during the whole measuring time and the resulting valu...

Страница 21: ...ay to indicate that it is waiting to start instant 00 in the new measuring interval at the hour following the initial one see e g if measurement is started at 8 49 the second measurement will be started at 9 49 00 Shows the measuring range again instead of the measuring time Tm This operation is repeated for each of the remaining 24 intervals Fig 16 Screen of instrument waiting to start a new reco...

Страница 22: ...aph icon to indicate the type of graphic display of the results with flashing cursor on the icon press the or keys to pass to numerical display The messages Ready Run Wait or End to respectively indicate waiting to start measuring measurement in progress waiting to start measuring in new range and end of measurement The indication in real time e g 49 0 dB of the sound pressure level measured by th...

Страница 23: ...f instant values of Integral analysis Line 1 The left part shows the current date time set on the instrument while the right part shows the measuring range currently used by the instrument Date time setting Use the and keys to move the flashing cursor to fields YYYY year MM month DD day HH hours MM minutes SS seconds and use the and keys to carry out the desired programming Configuration of the me...

Страница 24: ...ely that the instrument is ready to carry out a recording Integr mode that a recording is in progress that a recording has finished and that the whole operation has been completed The icon which allows saving the values on the display in the instrument s memory 3 In the instant display the following operations associated to the icon are possible With cursor flashing on the icon press the key to sa...

Страница 25: ...me Tm Ts the instrument stops the integration measurement and the End message appears on the display Data are automatically saved in the instrument s memory 7 By pressing the key while a process is in progress the instrument pauses measurement and the Pause message appears on the display In this situation By pressing the key the instrument stops measuring shows the Finish message on the display an...

Страница 26: ...in menu consisting of 6 icons on the display 3 Select the relevant icon and press to enter the specific menu List the instrument shows in numerical form the sound pressure level for each central band frequency in the range 16Hz 16kHz 1 1 analysis and in the range 12 5Hz 16kHz 1 3 analysis and the equivalent levels weighted A C and Z Graph the instrument shows the histograms of the 1 1 and 1 3 anal...

Страница 27: ...he reading takes approximately 3s to become stable Lines 2 8 The central part of the display shows the instant values of the sound pressure level for each central band frequency from 16Hz to 16kHz further to the values of the equivalent noise levels Leq1s and Leq T updated in real time at each second Also the values of parameters LA LC LZ weighted in modes A C and Z are shown Line 8 This line cont...

Страница 28: ...e measurement being carried out is cancelled and the instrument waits for a new recording 7 In the List and Leq1s display the following operations associated to the icon are possible With cursor flashing on the icon press the key to save the instant data shown on the display in the memory area see During this operation the icon is completely highlighted for a few seconds before it goes back to nor...

Страница 29: ...erical display 12 With cursor flashing on the icon press the or keys to access the Total display of the measure or select the Total icon in the main menu The instrument displays the following screen relevant to the Linst item Fig 26 Total section screen 1 1 spectrum analysis Instant values 2 The initial part shows the system date time and the measuring range which can be modified by using the or k...

Страница 30: ...with the or keys The instrument shows the following screen relevant to the values of the equivalent noise level Fig 28 Total section screen 1 1 spectrum analysis LeqT values 18 Press the key to start recording the values of the spectrum analysis 1 1 with a duration equal to the total measuring time Tm defined in the programming menu see 4 6 In this condition the indication of the measuring range d...

Страница 31: ...rnal memory 22 When pressing the key with paused instrument the measurement being carried out is cancelled and the instrument waits for a new recording CAUTION The main menu cannot be selected while recording Cancel or stop recording to carry out this operation The Max and Lock functions are not active while recording values ...

Страница 32: ... Use the and keys to move the flashing cursor to symbol R 2 Use the and keys to select the measuring range among the following options 0 90dB 10 100dB 20 110dB 30 120dB 40 130dB 50 140dB according to the reading carried out by the instrument After each modification the reading takes approximately 3s to become stable Line 2 In this line by using the and keys it is possible to select the type of fre...

Страница 33: ...indication of the measuring range disappears and the measuring time appears and cannot be changed while recording and the Leq T icon appears automatically on the display The instrument displays the following screen Fig 30 Activation of recording of 1 3 spectrum analysis 3 By pressing the key while recording the instrument is paused Press the key a second time to start recording again 4 When the in...

Страница 34: ...he measure or select the Graph icon in the main menu The instrument displays the following screen Fig 31 Graphic screen of 1 3 spectrum analysis 14 The screen shows the histogram of the sound pressure level associated to the frequency spectrum whose center is reported on the x axis further to the indications of the frequency weightings A C and Z The minimum and maximum values on the y axis are det...

Страница 35: ... in frequency weightings A C Z and with time constants Fast Slow Impulse LAFp LCFp LZFp LASp LCSp LZSp LAIp LCIp LZIp Lines 7 and 8 show in graphic bars the instant values of the quantities LAFinst LASinst LAIinst LCFinst LCSinst LCIinst LZFinst LZSinst LZIinst 3 Select the icon and confirm with to save the data in the instrument s memory CAUTION The Max and Lock functions are not active for insta...

Страница 36: ...suring range disappears and the measuring time appears and cannot be changed while recording and the Leq T icon appears automatically on the display 8 By pressing the key while recording the instrument is paused Press the key a second time to start recording again 9 When the instrument reaches the measuring time Tm Ts the instrument stops the integration measurement and the data are automatically ...

Страница 37: ...e free field correction of the microphone on the sound level meter To use the instrument with microphones this parameter is 0 15dB at a frequency of 1kHz To change this value proceed as follows Use the keys or to select Mod and confirm with The Mod field appears highlighted Use the or keys to move the cursor to Line 2 and the or keys to define the value in steps of 0 1dB Accordingly also the App f...

Страница 38: ...rrent sensitivity level of the microphone Line 6 This line contains the menu items which can be selected by the user The Rec option allows displaying the results of each calibration operation The Cal Option allows activating the calibration procedure see 6 1 3 The App option is used for saving each setting defined by the user during the manual adjustment procedures of the sensitivity levels The Mo...

Страница 39: ...t reaches the operating temperature 2 Use the or to select the Calibrate icon and confirm with to enter the calibration mode see Fig 35 3 Set the value of the sound pressure level to 94 0dB or 114 0dB according to the values available on the calibrator HT151 see 6 1 2 Line 4 as follows Use the keys or to select Mod and confirm with The Mod field appears highlighted Use the or keys to move the curs...

Страница 40: ...tion and press the key to save the new sensitivity level of the microphone in the memory 9 If the difference between the previous sensitivity level and the new level measured with calibration is 3dB for a few seconds the instrument shows the message The difference between these two sensitivity is too large Please affirm the calibration is correct If so repeat the calibration procedure and if neces...

Страница 41: ...Use the or keys to go to the screens on the following pages 3 Press the key to exit the mode and to go back to the previous page 6 1 4 DIRECT ACOUSTIC CALIBRATION In case the calibrator is not available and with an a priori known indication of the sensitivity level of the microphone this parameter can be set directly on the instrument as follows 1 Use the keys or to select Mod and confirm with The...

Страница 42: ...instrument shows the following screens which can be selected by using the and keys Fig 40 Screens of saved data Num Indicates the number of the used memory location Name Indicates the measure name defined by the user Date Indicates the date in which the measure was saved Time Indicates the time in which the measure was saved Mode Indicates the type of measure saved STA statistic data analysis INT ...

Страница 43: ...e 3 This line shows the type of STA measurement and the measuring time defined in the programming menu see 4 6 Line 4 This line shows the measuring range selected before starting measuring Lines 5 10 These lines show the numerical values measured by the instrument 2 Press the key to view the graphic trend of the statistic analysis and again to view the cumulative values of distribution Fig 42 Grap...

Страница 44: ...the type of 24Hxx measurement where xx stands for the number of intervals considered max 24 and the measuring time defined in the programming menu see 4 6 Line 4 This line shows the measuring range selected before starting measuring Lines 5 10 These lines show the numerical values measured by the instrument 2 Press the key to display in detail the value of each interval considered e g 8 intervals ...

Страница 45: ...n graphic of the 24H analysis values 4 Press the or keys to go to the next pages and the or keys to display the values of data in the single intervals 5 Press the key again to go back to numerical display or the key to go back to the initial screen ...

Страница 46: ...ng menu see 4 6 Line 2 This line shows the date time when measurement was started Line 3 The type of INT measurement is shown Line 4 This line shows the measuring range selected before starting measuring Lines 5 10 These lines show the numerical values measured by the instrument 2 Press the key to access the final page The instrument shows the following screen which also indicates the measuring ti...

Страница 47: ... menu see 4 6 Line 2 Page1 This line shows the date time when measurement was started Line 3 Page1 The type of OCT measurement is shown Line 4 Page1 This line shows the measuring range selected before starting measuring Lines 5 10 These lines show the numerical values measured by the instrument divided into each central band frequency considered 2 Press the key to access the graphic display of the...

Страница 48: ... analysis data Line 1 Page1 This line shows the measure name defined in the programming menu see 4 6 Line 2 Page1 This line shows the date time when measurement was started Line 3 Page1 The type of ALL measurement is shown Line 4 Page1 This line shows the measuring range selected before starting measuring Lines 5 10 These lines show the values of the sound pressure levels both instant and relevant...

Страница 49: ... 3 Page1 The type of 1 3OCT measurement is shown Line 4 Page1 This line shows the measuring range selected before starting measuring Lines 5 10 These lines show the numerical values measured by the instrument Leq1s o Leq T divided into each central band frequency f0 Hz considered CAUTION Independently from the type of frequency weighting selected for measurement the saved data include anyway also ...

Страница 50: ...instrument checks the initialization of the connected pen drive and verifies if the necessary space for a correct data transfer is available In case of insufficient memory space in the USB pen drive the instrument shows a message on the display 5 After transfer is completed the instrument shows the same screen as in section Data see Fig 40 6 In the USB pen drive the instrument creates a subfolder ...

Страница 51: ...le format Copy and print directly the data downloaded by the instrument to PC 8 2 MINIMUM SYSTEM REQUIREMENTS The following characteristics are necessary for a correct installation and use of the software Processor Pentium III 500MHz or higher RAM memory 128Mbytes 100Mbytes of free space available on HD Operating system Windows 2k or higher 8 3 INSTALLING THE DRIVER USB When connecting the instrum...

Страница 52: ...e USB pen drive provided after saving the content of the pen drive on the HD of the PC Press Next 6 Select the file with extension ch375wdm inf and proceed with Next 7 The installation procedure of the driver is started by the PC 8 Press Finish to stop the installation procedure of the USB driver ...

Страница 53: ...n Fig 53 Initial software screen 8 4 1 COPY AND PRINT COMMANDS With a open measure shown to PC command Input Data of File menu perform a right click on measure name the Copy and Print are available on program Fig 54 Use of Copy and Print commands Copy A copy of graph and numerical data of current measure in a XLS file is performed Print The direct print of graph and numerical data of current measu...

Страница 54: ...rument corresponding to files with TXT extension Setup CTRL Z Key It allows selecting the communicating mode USB between instrument and PC the option Serial Port is not active and the path in which to save the data of the recordings downloaded from the instrument Path Press SAVE to confirm Export to XLS It allows exporting all the measures currently open in an Excel file format XLS The software al...

Страница 55: ...d Write In CTRL R Key It allows sending to the instrument the whole list of the measure names defined by the user which can be viewed in section Measure Name of the program Before carrying out this operation the program shows the following window where it is necessary to put in the instrument s serial number on the rear side of the instrument itself in the same format as it is written on the label...

Страница 56: ...g the whole instrument s memory content Before carrying out this operation the program requires that the instrument s serial number is correctly put in 8 4 6 CALIBRATION MENU This menu contains the controls to manage the information relevant to the calibrations performed on the instrument by using the portable calibrator HT151 see 6 1 3 Control Description Read Cal CTRL X Key It allows saving on t...

Страница 57: ...2 REPLACING THE BATTERIES When the LCD display shows the symbol and the message BATTERY LOW it is necessary to replace the internal batteries Fig 55 Replacement of internal batteries 1 Turn off the instrument 2 Open the battery compartment 3 Removed the old batteries see Fig 55 4 Insert new batteries of the same type see 10 5 respecting the indicated polarities 5 Close the battery compartment 6 Do...

Страница 58: ...sitivity of 50mV Pa frequency range 10Hz 20kHz basic noise 16dB A Linear dynamic range 90dB Resolution 0 1dB statistic 0 01dB 1 1 and 1 3 octave Frequency range 10Hz 20kHz 0 2dB 1Hz 23kHz 1 0dB Gain range 10dB 0dB 10dB 20dB 30dB 40dB Internal error 0 1dB Internal noise voltage 4 V 1Hz 23kHz linear Background noise 13dB A 15dB C 25dB Z Total noise 18dB A 23dB C 28dB Z Voltage measuring range 15 V 1...

Страница 59: ...l G 2 for analysis 1 1 and 1 3 octave band Central frequencies of 1 1 octave band 16Hz 31 5Hz 63Hz 125Hz 250Hz 500Hz 1kHz 2kHz 4kHz 8kHz 16kHz see 12 2 and 12 3 Central frequencies of 1 3 octave band 12 5Hz 16Hz 20Hz 25Hz 31 5Hz 490Hz 50Hz 63Hz 80Hz 100Hz 125Hz 160Hz 200Hz 250Hz 315Hz 400Hz 500Hz 630Hz 800Hz 1kHz 1 25kHz 1 6kHz 2kHz 2 5kHz 3 15kHz 4kHz 5kHz 6 3kHz 8kHz 10kHz 12 5kHz 16kHz see 12 2...

Страница 60: ...perating temperature 5 40 C 41 F 104 F Operating humidity 80 RH up to 31 C and 50 RH at 40 C Storing temperature 10 60 C 14 F 140 F Storing humidity 70 RH Reference standard Statistic analysis and integration IEC 61672 2002 Class 1 CNS 7129 IEC 60651 1979 Type 1 IEC60804 2000 Type 1 1 1 and 1 3 analysis HT157 only IEC 61260 1995 Class 1 This instrument complies with the requirements of European Di...

Страница 61: ...onsequence of improper packaging Repairs which may become necessary as a consequence of interventions performed by unauthorized personnel Modifications to the instrument performed without the manufacturer s explicit authorization Use not provided for in the instrument s specifications or in the instruction manual The content of this manual cannot be reproduced in any form without the manufacturer ...

Страница 62: ...HT155 HT157 EN 60 12 APPENDIXES 12 1 APPENDIX 1 FREQUENCY WEIGHTING CHARACTERISTICS ...

Страница 63: ...HT155 HT157 EN 61 12 2 APPENDIX 2 CHARACTERISTICS OF 1 3 OCTAVE BAND FILTER ...

Страница 64: ...HT155 HT157 EN 62 ...

Страница 65: ...HT155 HT157 EN 63 ...

Страница 66: ... 8 5 800 0 8 0 20 50 5 6 2 1000 0 0 25 44 7 4 4 1250 0 6 0 31 5 39 4 3 0 1600 1 0 0 1 40 34 6 2 0 2000 1 2 0 2 50 30 2 1 3 2500 1 3 0 3 63 26 2 0 8 3150 1 2 0 5 80 22 5 0 5 4000 1 0 0 8 100 19 1 0 3 5000 0 5 1 3 125 16 1 0 2 6300 0 1 2 0 160 13 4 0 1 8000 1 1 3 0 200 10 9 0 10000 2 5 4 4 250 8 6 0 12500 4 3 6 2 315 6 6 0 16000 6 6 8 5 400 4 8 0 20000 9 3 11 2 ...

Страница 67: ...HT155 HT157 EN 65 12 4 APPENDIX 4 CHARACTERISTICS OF 4HZ HIGH PASS DIGITAL FILTER ...

Отзывы: