292
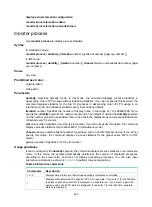
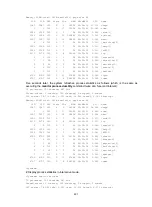
Memory: 496M total, 341M available, page size 4K
JID PID PRI State FDs MEM HH:MM:SS CPU Name
1047 1047 120 R 9 1420K 00:02:39 14.13% diagd
1 1 120 S 17 1092K 00:00:23 3.98% scmd
1027 1027 120 S 12 9280K 00:01:13 1.44% devd
1000 1000 115 S 0 0K 00:00:09 0.36% [sock/1]
1009 1009 115 S 0 0K 00:00:09 0.36% [karp/1]
4 4 115 S 0 0K 00:00:06 0.18% [ksoftirqd/0]
1010 1010 115 S 0 0K 00:00:13 0.18% [kND/1]
4795 4795 120 S 11 2372K 00:00:01 0.18% telnetd
5491 5491 120 S 8 1500K 00:00:00 0.18% top
2 2 115 S 0 0K 00:00:00 0.00% [kthreadd]
The system refreshes process statistics every 5 seconds. You can enter interactive commands to
perform operation as follows:
•
Enter
h
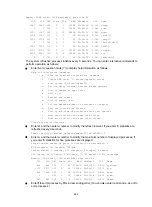
or a question mark (?) to display help information as follows:
Help for interactive commands:
?,h Show the available interactive commands
1 Toggle SMP view: '1' single/separate states
c Sort by the CPU field(default)
d Set the delay interval between screen updates
f Sort by number of open files
k Kill a job
l Refresh the screen
m Sort by memory used
n Set the maximum number of processes to display
q Quit the interactive display
t Sort by run time of processes since last restart
< Move sort field to the next left column
> Move sort field to the next right column
Press any key to continue
•
Enter
d
, and then enter a number to modify the refresh interval. If you enter
3
, statistics are
refreshed every 3 seconds.
Enter the delay interval between updates(1~2147483647): 3
•
Enter
n
, and then enter a number to modify the maximum number of displayed processes. If
you enter
5
, statistics for five processes are displayed.
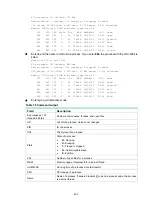
Enter the max number of procs to display(0 is unlimited): 5
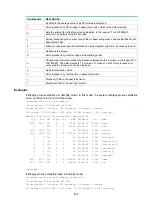
87 processes; 113 threads; 735 fds
Thread states: 2 running, 111 sleeping, 0 stopped, 0 zombie
CPU states: 86.57% idle, 0.83% user, 11.74% kernel, 0.83% interrupt
Memory: 755M total, 414M available, page size 4K
JID PID PRI State FDs MEM HH:MM:SS CPU Name
864 864 120 S 24 27020K 00:00:43 8.95% syslogd
1173 1173 120 R 24 2664K 00:00:01 2.37% top
866 866 120 S 18 10276K 00:00:09 0.69% devd
1 1 120 S 16 1968K 00:00:04 0.41% scmd
881 881 120 S 8 2420K 00:00:07 0.41% diagd
•
Enter
f
to sort processes by FDs in descending order. (You can also enter command
c
,
m
, or
t
to
sort processes.)
Содержание FlexNetwork 7500 Series
Страница 238: ...229 Sysname ...
Страница 420: ...411 Related commands packet capture ...
Страница 430: ...421 U url 78 username 79 user role 249 V version 80 vpn instance 81 W Websites 415 X xml 227 ...

