Statistics aplet
8-15
Plotting
You can plot:
•
histograms (
)
•
box-and-whisker plots (
)
•
scatter plots (
).
Once you have entered your data (
), defined your
data set (
), and defined your Fit model for two-
variable statistics (
SETUP
-
SYMB
), you can plot your
data. You can plot up to five scatter or box-and-whisker
plots at a time. You can plot only one histogram at a time.
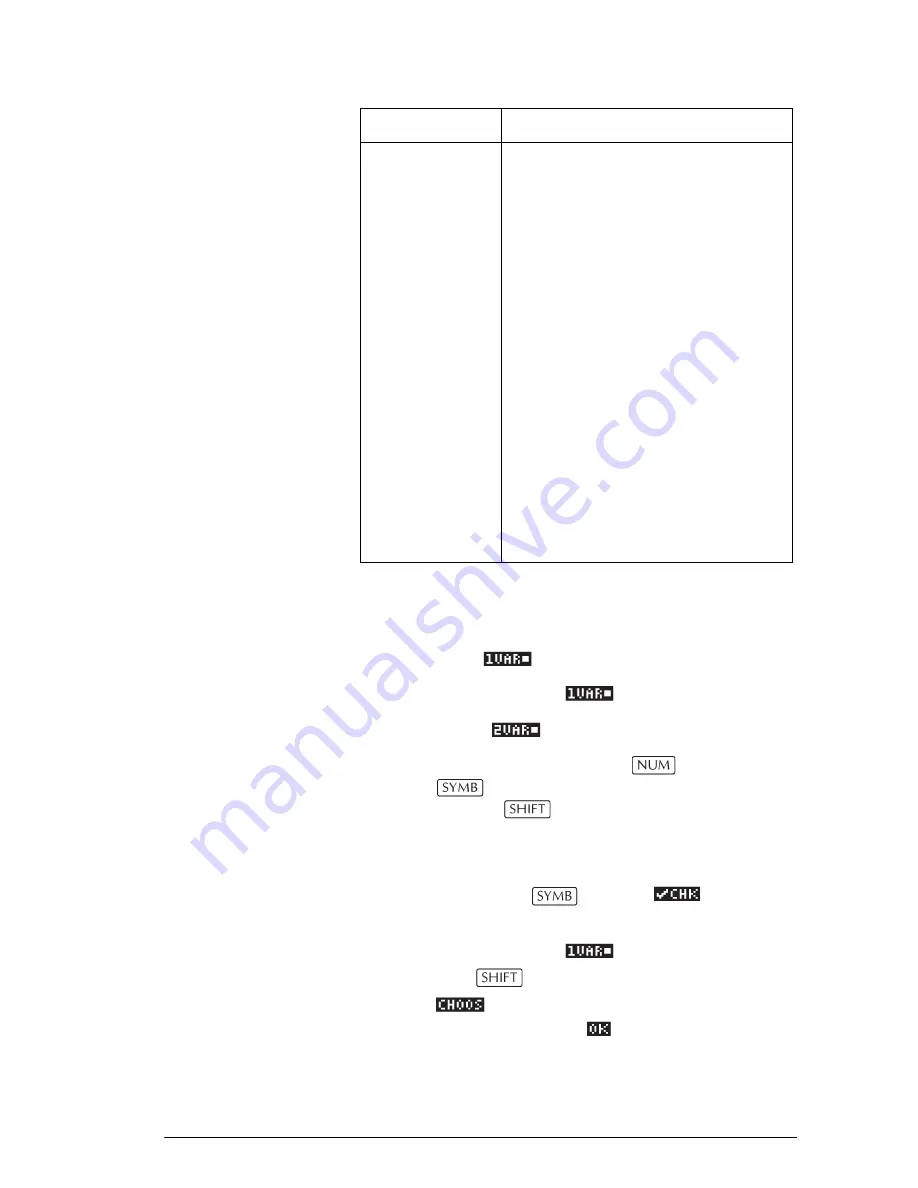
To plot statistical
data
1. In Symbolic view (
), select (
) the data
sets you want to plot.
2. For one-variable data (
), select the plot type in
Plot Setup (
SETUP
-
PLOT
). Highlight
STATPLOT
,
press ,
select
either
Histogram
or
BoxWhisker
, and press
.
Σ
Y2
Sum of
y
2
-values.
Σ
XY
Sum of each
xy
.
SCOV
Sample covariance of independent
and dependent data columns.
PCOV
Population covariance of
independent and dependent data
columns
CORR
Correlation coefficient of the
independent and dependent data
columns
for a linear fit only
(regardless of the Fit chosen).
Returns a value from 0 to 1, where
1 is the best fit.
RELERR
The relative error for the selected
fit. Provides a measure of accuracy
for the fit.
Statistic
Definition (Continued)
Содержание 39g+
Страница 1: ...hp 39g graphing calculator user s guide H Edition 2 Part Number F2224 90001 ...
Страница 62: ...2 22 Aplets and their views 5 Display the functions in numeric form ...
Страница 78: ......
Страница 83: ...Sequence aplet 6 3 Select Cobweb Display the table 6 Display the table of values for this example ...
Страница 84: ......
Страница 116: ......
Страница 178: ......


