Page 18 of 40
FIRElink-25 – Installation Manual
©
2010 Hochiki Europe (UK) Ltd
9-5-0-344/ISS4/OCT10
2.10 Chart Recording
The chart recording function shows how smoke density in the protected area has varied over time. The
chart may be downloaded to disk or printed out from a connected printer.
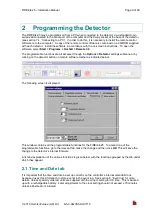
To access the chart log, select the menu options
View > Chart Recording
or click the button on the
toolbar as indicated below:
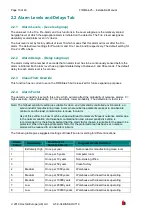
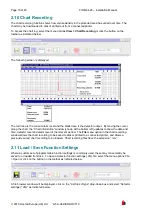
The following screen is displayed:
The red trace is the current alarm level and the black trace is the detector output. By moving the cursor
along the chart, the “Chart information” window (shown at the bottom left) updates to show the date and
time, detector level and alarm level of the relevant period. The
File
menu option in the chart recording
window allows the chart recording to be saved to disk or printed to a connected printer, and allows a
previously saved chart recording to be loaded. Chart recording files have the extension “.rcw”.
2.11 Load / Save Function Settings
Where a custom set of programmable function settings is commonly used, these may conveniently be
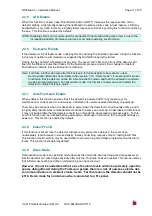
saved to or loaded from disk. To open a detector function settings (.dfs) file, select the menu options File
> Open or click on the button on the toolbar as indicated below:
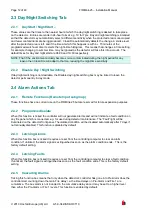
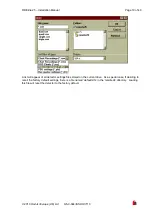
A file browser window will be displayed, click on the “List files of type” drop-down box and select “Detector
settings (*.dfs)” as indicated below:


