−
19
−
4.GRAPH MODE
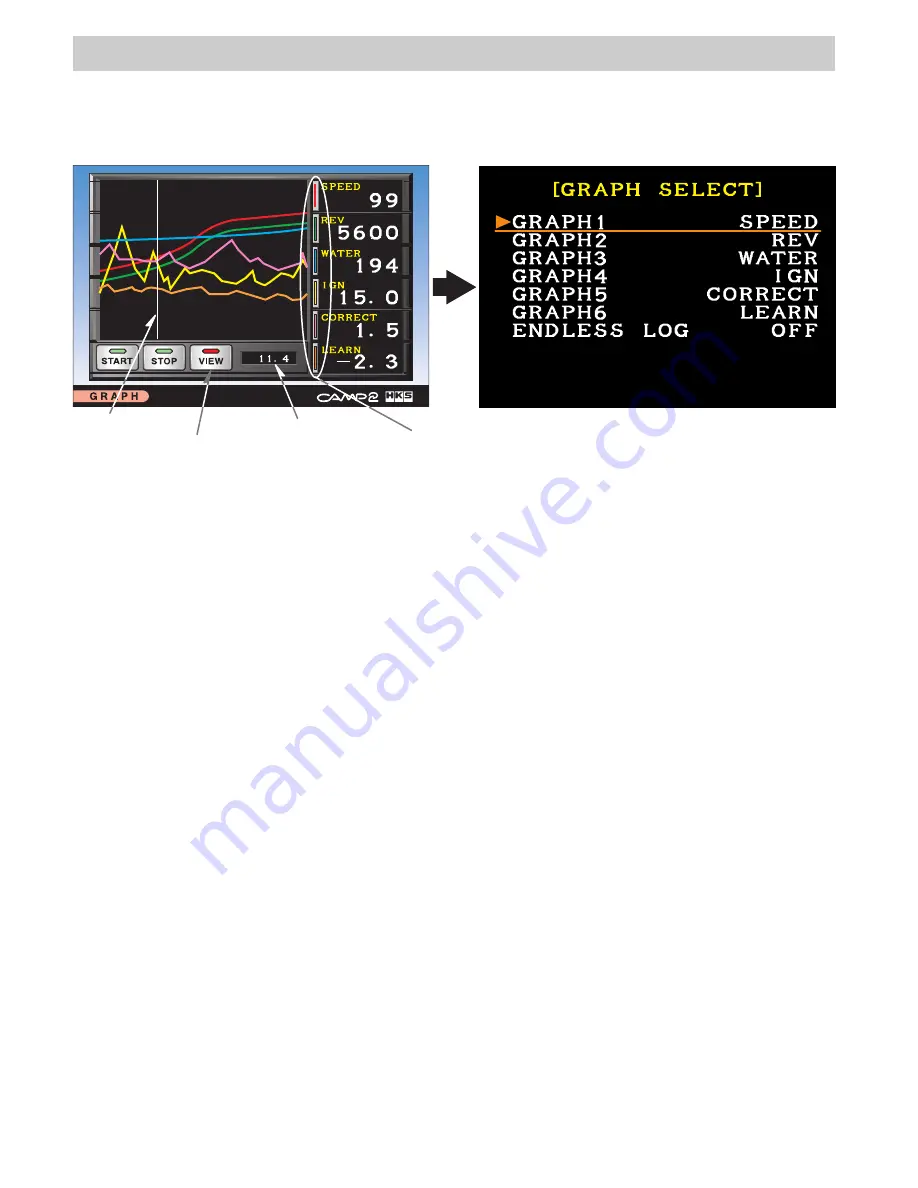
Time
While logging,
-LOG- is shown.
Select from Start,
Stop, or View.
These colors
correspond to
the graph line.
Time axis
・
A graph and digital meter indication on a time-based axis of up to 6 items can be shown on
the screen.
・
VIEW function: data changes at 0.2 second intervals can be monitored.
・
Logging can be conducted for up to 600 seconds (10 minutes).
<Setting>
・
Select [GRAPH] in the menu using the controller's directional arrow buttons. Press ENTER.
・
Switch the screen to [GRAPH SELECT] screen using the controller's SELECT button.
(The right illustration above)
●
GRAPH 1 - 6 (Setting Items)
・
Select a graph from GRAPH 1 -6 using the controller's directional arrow buttons.
Press ENTER. When the characters' color changes to orange, setting changes can be made.
・
Select one item from 25 items using the controller's directional arrow buttons. Press ENTER.
When the characters' color changes to white, setting changes can be made. (When NONE
appears, no item is available to be shown.)
・
If more than one item needs to be edited, repeat the above procedure.
●
ENDLESS LOGGING (Setting logging)
・
Sets the logging to function endlessly in a loop (up to 10 minutes per loop).
ENDLESS LOG OFF
ENDLESS LOG ON
After changing the setting, press the BACK button to return to the graph screen (The left
illustration above).
<Operation>
・
Start Logging
Select "START" using the controller's directional arrow buttons. Press ENTER.
・
Stop Logging
Select "STOP" using the controller's directional arrow buttons. Press ENTER.
・
Check the Logging Data
・
Select "VIEW" using the controller's directional arrow buttons. Press ENTER.
・
Each item's data can be monitored based on time. The numbers are shown in the digital
meter on the right. The time is shown below the graph.
: Logging is continued for 10 minutes and stopped.
: 10 minutes logging is repeated until stopped.


