H8 DSP
Digital Interface Processor
User’s manual
8.12
GRAPHIC EQUALIZER
9
5
1
2
3
4
8
- Zoom
+ Zoom
38
The
H8 DSP
software features a 31-band, ± 12 dB
graphic equalizer for each system channel.
In compliance with ISO requirements, frequencies are
equally spaced at 1/3 Oct. from 20 to 20 kHz.
The equalizer works by groups. By default the equalizer
groups will be:
-
one equalizer for the
Front
.
-
one equalizer for the
Rear
.
-
one equalizer for the
Center
.
-
one equalizer for the
Subwoofer
.
E.g.:
examining the system described so far there would be:
-
one equalizer for the
Front
Mid-Tweeter
.
-
one equalizer for the
Front Woofer
.
-
one equalizer for the
Rear
.
-
one equalizer for the
Center
.
-
one equalizer for the
Subwoofer
.
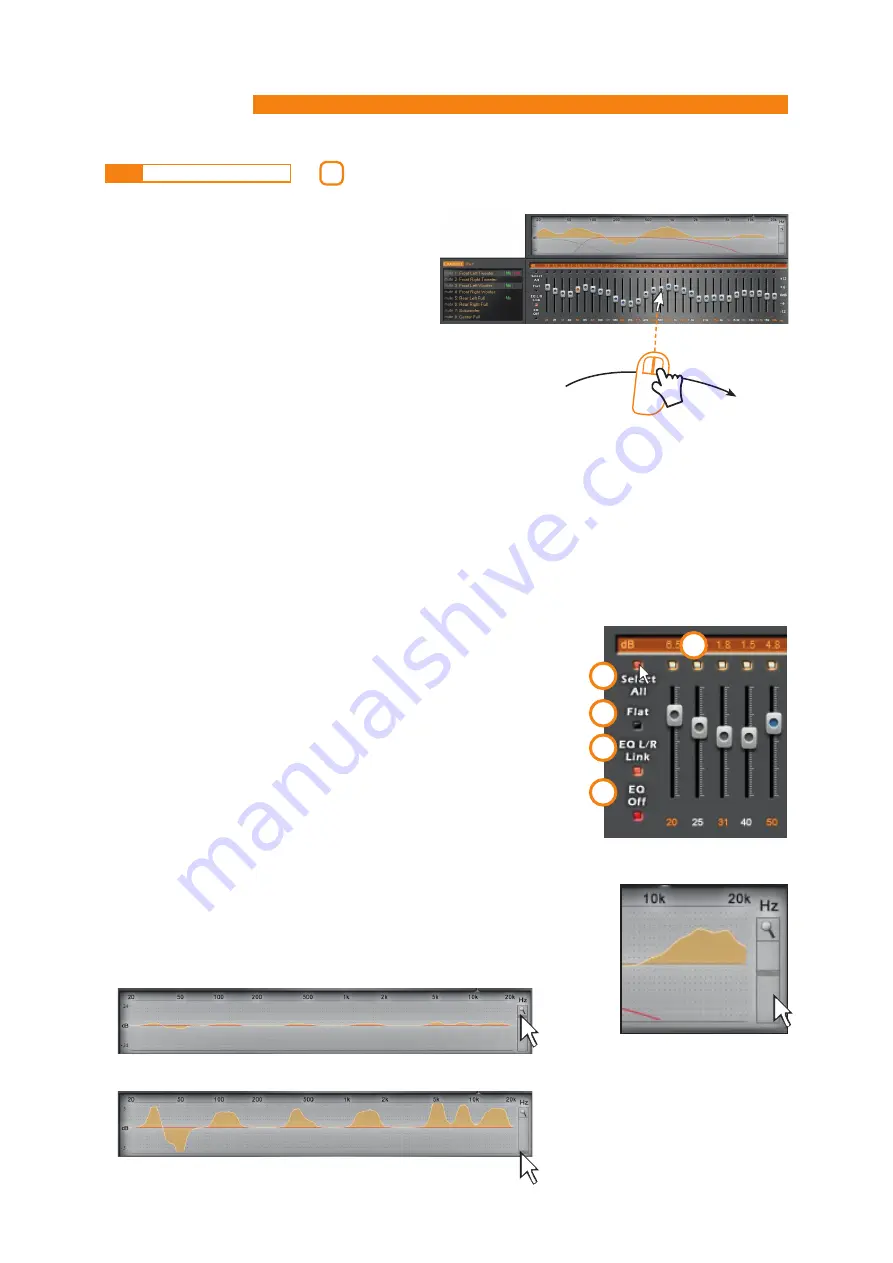
In order to set an equalization curve, the only requirement is to select the
channel to be equalized from the
Channel Map
menu and left-click the slider
you want to set with the mouse.
To shape an equalization curve, , the only requirement is to right-click the
first slider on the left of the equalizer and move the equalizer sliders towards
the right, shaping the curve as desired
(see Fig. 1)
.
Fig.1
Fig.2
Fig.3
Example of visualization with magnifier function ± 24dB
Example of visualization with magnifier function ± 3dB
The graphic equalizer features five specific functions to ease the calibration
(see Fig. 2)
.
1.
Select ALL
once an equalization curve has been set, this function provides
the ability to move all the sliders at the same time.
2.
Flat
, allows for all the sliders to go back to the 0 dB position;
3.
EQ L/R Link
when active, it applies the equalization curve to both the right
and the left channel simultaneously.
4.
EQ Off
when active, it provides the ability to disable the equalizer to check
its effect without losing its settings.
5.
One
Select
button for each equalizable band, providing the ability to move
all the selected sliders together.
Remark:
in order to clearly display the set equalization curve, the vertical axis
(dB) can be increased or decreased by moving the slider on the right of the
equalization curve graph up/down
(Fig. 3)
. By default the graph visualization
range is set at ± 12dB.


