Genelec Frequency Response Optimisatio Скачать руководство пользователя страница 4

GOLDBERG AND MÄKIVIRTA


AUTOMATED IN-SITU EQUALISATION


AES 23RD CONFERENCE, May 23-25, 2003 

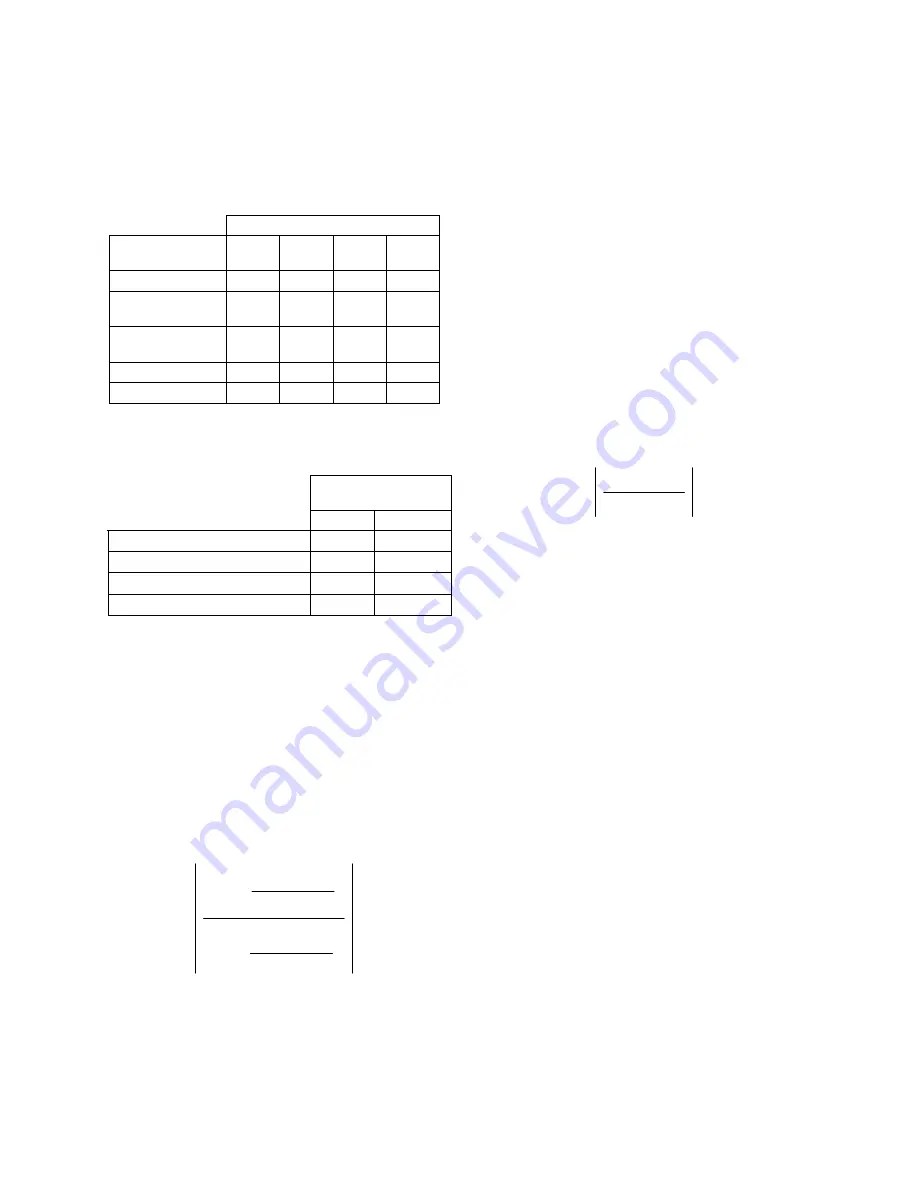
certain frequency ranges in each stage (Table 7). 
Figure 5 in Appendix A shows a flow chart of the 
software. A screenshot of the software graphic user 
interface can be seen in Appendix B. 

Table 6. Optimisation stages. 


Type of loudspeaker 

Optimisation 

stage Large 3-way 2-way Small 

2-way 

Preset bass roll-off 

9


9


9


9


Find midrange/ 
treble ratio 

9


9


- - 

Set bass tilt and 
level 

9


9


- - 

Reset bass roll-off 

9


9


9


9


Set treble tilt 

9


9


9


Table 7. Optimiser frequency ranges; 

f

HF

 = 15 kHz; 

f

LF


is the frequency of the lower –3 dB limit of the fre-
quency range. 


Frequency Range 

Limit 

 Low 

High 

Loudspeaker pass band 

f

LF


f

HF


Midrange and treble driver band 

500 Hz 

f

HF


Bass roll-off region 

f

LF

 1.5 

f

LF


Bass region  

1.5 

f

LF

 6 

f

LF


3.2.1.  Pre-set Bass Roll-off 

In this stage, the bass roll-off control is set to keep the 
maximum level found in the ‘bass roll-off region’ as 
close to the maximum level found in the ‘bass region’. 
Once found the bass roll-off control is reset to one po-
sition higher, for example, –4 dB is changed to –2 dB. 
The reason for this is to leave some very low bass en-
ergy for the bass tilt to filter. It is possible that the 
bass tilt alone is sufficient to optimise the response 
and less or no bass roll-off is eventually required. The 
min-max type objective function to be minimised is 
given by Equation 2,  


[

]

[

]

3

2

2

1

0

0

,

,

,

,

)

(

)

(

)

(

max

)

(

)

(

)

(

max

min

f

f

f

f

f

f

f

x

f

x

f

a

f

x

f

x

f

a

E

b

a

m

b

f

m

f

m

a

=

=









=

 (2)


where 

x

(

f

) is the smoothed magnitude of the in-situ 

frequency response of the system, 

a

m

(

f

) is the bass 

roll-off setting 

m

 currently being tested, 

x

0

(

f

) is the 

target response, 

f

a

 defines the ‘bass roll-off region’ 

(Table 7) and 

f

b

 defines the ‘bass region’ (Table 7). 

User selected frequency ranges are not permitted. 
The reason for this arrangement rather than using a 
least squares type objective function is that the bass 
roll-off tends to assume maximum attenuation to 
minimise the RMS deviation. This type of objective 
function does not yield the best setting, as subjectively 
a loss of bass extension is perceived. This stage of the 
optimiser algorithm takes six filtering steps (three for 
small two-way models). 
 

3.2.2.  Midrange Level to Treble Level Ratio 

The aim of this stage is to find the relative levels of 
the midrange level and treble level controls required 
to get closest to the target response. The least squares 
type objective function to be minimised is given in 
Equation 3, 


df

f

x

f

x

f

a

E

f

f

f

m

m

2

0

2

1

)

(

)

(

)

(

min

=

=

 (3) 

where 

x

(

f

) is the smoothed magnitude of the in-situ 

frequency response of the system, 

a

m

(

f

) is the mid-

range and treble level control combination 

m

 currently 

being tested, 

x

0

(

f

) is the target response, 

f

1

 and 

f

2

 de-

fine the ‘midrange and treble driver band’


(Table 7). 

The lower frequency bound is fixed at 500 Hz but a 
user selectable high frequency value is permitted. The 
default value is 15 kHz. 
The midrange-to-treble level ratio is saved for per-
forming the third stage of the optimisation process. 
The reason for this is to reduce the number of room 
response control combinations to be tested in the next 
stage. This stage of the optimisation algorithm takes 
49 filtering steps and is not required for two-way 
models or small two-way models. 
 

3.2.3.  Bass Tilt and Bass Level 

This stage of the optimiser algorithm filters using all 
possible combinations of bass tilt and bass level con-
trols for a given midrange/treble level difference. By 
fixing this difference the total number of filter combi-
nations can be reduced substantially. 
A constraint imposed in this stage is that only two of 
the driver level controls can be set at any one time. If 
three of the level controls are simultaneously set the 
net effect is a loss of overall system sensitivity. Table 
8 shows an example of incorrect and correct setting of 
the driver level controls. 

Содержание Frequency Response Optimisatio

Страница 1: ...ce of calibrating active loud speakers Even with experienced system calibrators significant variance between calibrations can be seen Furthermore with a number of different people cali brating loudspeaker systems additional variance in results will occur For these reasons an automated calibration method was developed to ensure consis tency of calibrations Presented first in this paper is the discr...

Страница 2: ...al to significantly improve perceived sound quality The practical challenge is the selection of the best settings for the low order in situ equaliser Despite advances in psychoacoustics it is difficult to quantify what the listener actually perceives the sound quality to be or to optimise equalisation based on that evaluation 13 15 Because of this in situ equalisa tion typically attempts to obtain...

Страница 3: ...re determined by the crossover filters The bass tilt control compensates for a bass boost seen when the loudspeaker is loaded by large nearby boundaries 33 36 This typically happens when a loudspeaker is placed next to or mounted into an acoustically hard wall This filter is a first order shelv ing filter The bass roll off control compensates for a bass boost often seen at the very lowest frequenc...

Страница 4: ...her than using a least squares type objective function is that the bass roll off tends to assume maximum attenuation to minimise the RMS deviation This type of objective function does not yield the best setting as subjectively a loss of bass extension is perceived This stage of the optimiser algorithm takes six filtering steps three for small two way models 3 2 2 Midrange Level to Treble Level Rat...

Страница 5: ...tics of experienced calibration engineers The resulting num ber of filtering steps has been dramatically reduced for the larger systems Table 9 and even the relatively simple two way systems show a substantial improve ment when compared to the number of filtering steps needed by direct search method as summarised in Table 5 There are two main reasons for the improve ment the constraint of not allo...

Страница 6: ... there is also a 3 dB roll off with 50 Hz being down by 1 dB and 40 Hz by 2 dB Tolerance lines are set to 3 dB with additional leeway at low and high fre quencies 1 An example of the room equaliser settings output for the large system optimised in Figure 1 is shown in Figure 2 The optimised result is displayed in green and dark grey boxes The green boxes are room re sponse controls that should be ...

Страница 7: ...d tonal bal ance improvement This is indicated by a reduction of the median value differences 4 2 Example of Statistical Data Analysis Figure 7 in Appendix C shows a case example where room response control settings are calculated accord ing to the optimisation algorithm The equalisation target is a flat magnitude response straight line at 0 dB level The in situ frequency response of the loudspeak...

Страница 8: ...subbands show no changes or a slight increase of the RMS deviation Three way systems show a clear reduction in most cases of both the quartile difference Figure 13 and RMS deviation Figure 14 for the broadband and LF subband Slight and equal numbers of increases and reductions are seen for MF and HF subbands A similar trend is seen for the three large systems in cluded in this study Figure 15 16 M...

Страница 9: ...n the median level for the LF subband A similar outcome is noted sepa rately for each loudspeaker type However only in the three way systems is an improvement seen also in the MF and HF subband variance 25 to 75 Percentile Difference Change due to Equalisation All models 3 2 1 0 1 Broadband LF MF HF Level dB RMS Deviation Change due to Equalisation All models 5 4 3 2 1 0 1 Broadband LF MF HF Level...

Страница 10: ...d room response control settings The settings achieve im proved equalisation in the form of a smaller RMS de viation from the target response The improvement is not limited by the optimisation method but by the room response controls which are not intended to cor rect for narrow band deviations in the frequency re sponse Examples of these are response variations re sulting from acoustic issues suc...

Страница 11: ...Thesis at the Helsinki University of Technol ogy 41 8 REFERENCES 1 Genelec Oy http www genelec com 2003 Feb 2 Walker R Equalisation of Room Acoustics and Adaptive Systems in the Equalisation of Small Rooms Acoustics Proc 15th Int Conf paper 15 005 1998 Oct 3 Cox T J and D Antonio P Determining Op timum Room Dimensions for Critical Listening Envi ronments A New Methodology presented in 110th Conv A...

Страница 12: ...2001 Sep 29 Mäkivirta A Antsalo P Karjalainen M and Välimäki V Low Frequency Modal Equalisation of Loudspeaker Room Responses presented in 111th Conv Audio Eng Soc preprint 5480 2001 Sept 30 Karjalainen M Esquef P A A Antsalo P Mäkivirta A and Välimäki V Frequency Zooming ARMA Modelling of Resonant and Reverberant Sys tems J Audio Eng Soc vol 50 pp 1012 1029 2002 Dec 31 Moore B C J Glasberg B R Pl...

Страница 13: ...User Inputs Model Database Stored Measurement Microphone Compensation CTRL M Measurement Dump Reset Graph and Outputs Get Model Number Apply Mic Compensation Remove DC Window FFT and Smooth Load Impulse Response Set DIPtimisation Range Display Original Freq Response Display Target Response Calculate Target Resp Stored Measurement CLOSE DIPtimiser 1 2 Figure 5 Software flow chart part 1 CLOSE Set F...

Страница 14: ...5 2003 14 Is Large System Is Small System Load Filters Model Filters Preset BRO Find ML TL Ratio Set BL BT wrt ML TL Reset BRO Set TT Display Final Tone Control Settings Display Final Frequency Response Set BT Is 3 way System 1 2 Figure 5 continued Software flow chart part 2 Y N N Y ...

Страница 15: ...GOLDBERG AND MÄKIVIRTA AUTOMATED IN SITU EQUALISATION AES 23RD CONFERENCE May 23 25 2003 15 APPENDIX B SOFTWARE GRAPHICAL USER INTERFACE Figure 6 Software graphical user interface at start up ...

Страница 16: ... AND MÄKIVIRTA AUTOMATED IN SITU EQUALISATION AES 23RD CONFERENCE May 23 25 2003 16 APPENDIX C CASE EXAMPLE STATISTICAL GRAPHS Figure 7 Case example optimisation results Figure 8 Case example statistical output ...

Страница 17: ...5 4 0 3 5 3 0 2 5 2 0 1 5 1 0 0 5 0 0 0 5 1029A 1029A 1029A 1029A 1029A 1029A 1029A 1029A 1029A 1029A 1029A 1029A Level dB Low Frequency 25 to 75 Percentile Difference Before Equalisation 0 2 4 6 8 10 12 1029A 1029A 1029A 1029A 1029A 1029A 1029A 1029A 1029A 1029A 1029A 1029A Level dB Low Frequency 25 to 75 Percentile Difference After Equalisation 0 2 4 6 8 10 12 1029A 1029A 1029A 1029A 1029A 1029A...

Страница 18: ...2 0 1 5 1 0 0 5 0 0 0 5 1029A 1029A 1029A 1029A 1029A 1029A 1029A 1029A 1029A 1029A 1029A 1029A Level dB High Frequency 25 to 75 Percentile Difference Before Equalisation 0 2 4 6 8 10 12 1029A 1029A 1029A 1029A 1029A 1029A 1029A 1029A 1029A 1029A 1029A 1029A Level dB High Frequency 25 to 75 Percentile Difference After Equalisation 0 2 4 6 8 10 12 1029A 1029A 1029A 1029A 1029A 1029A 1029A 1029A 102...

Страница 19: ...to Equalisation 7 6 5 4 3 2 1 0 1 2 1029A 1029A 1029A 1029A 1029A 1029A 1029A 1029A 1029A 1029A 1029A 1029A Level dB Low Frequency RMS Deviation Before Equalisation 0 2 4 6 8 10 1029A 1029A 1029A 1029A 1029A 1029A 1029A 1029A 1029A 1029A 1029A 1029A Level dB Low Frequency RMS Deviation After Equalisation 0 2 4 6 8 10 1029A 1029A 1029A 1029A 1029A 1029A 1029A 1029A 1029A 1029A 1029A 1029A Level dB ...

Страница 20: ...Equalisation 7 6 5 4 3 2 1 0 1 2 1029A 1029A 1029A 1029A 1029A 1029A 1029A 1029A 1029A 1029A 1029A 1029A Level dB High Frequency RMS Deviation Before Equalisation 0 2 4 6 8 10 1029A 1029A 1029A 1029A 1029A 1029A 1029A 1029A 1029A 1029A 1029A 1029A Level dB High Frequency RMS Deviation After Equalisation 0 2 4 6 8 10 1029A 1029A 1029A 1029A 1029A 1029A 1029A 1029A 1029A 1029A 1029A 1029A Level dB H...

Страница 21: ...ence Before Equalisation 0 2 4 6 8 10 12 1030A 1030A 1031A 1031A 1031A 1031A 1031A 1031A 1031A 1032A 1032A Level dB Low Frequency 25 to 75 Percentile Difference Change due to Equalisation 4 5 4 0 3 5 3 0 2 5 2 0 1 5 1 0 0 5 0 0 0 5 1030A 1030A 1031A 1031A 1031A 1031A 1031A 1031A 1031A 1032A 1032A Level dB Broadband 25 to 75 Percentile Difference After Equalisation 0 2 4 6 8 10 12 1030A 1030A 1031A...

Страница 22: ... 3 0 2 5 2 0 1 5 1 0 0 5 0 0 0 5 1030A 1030A 1031A 1031A 1031A 1031A 1031A 1031A 1031A 1032A 1032A Level dB High Frequency 25 to 75 Percentile Difference Before Equalisation 0 2 4 6 8 10 12 1030A 1030A 1031A 1031A 1031A 1031A 1031A 1031A 1031A 1032A 1032A Level dB High Frequency 25 to 75 Percentile Difference After Equalisation 0 2 4 6 8 10 12 1030A 1030A 1031A 1031A 1031A 1031A 1031A 1031A 1031A ...

Страница 23: ...ange due to Equalisation 7 6 5 4 3 2 1 0 1 2 1030A 1030A 1031A 1031A 1031A 1031A 1031A 1031A 1031A 1032A 1032A Level dB Low Frequency RMS Deviation Before Equalisation 0 2 4 6 8 10 1030A 1030A 1031A 1031A 1031A 1031A 1031A 1031A 1031A 1032A 1032A Level dB Low Frequency RMS Deviation After Equalisation 0 2 4 6 8 10 1030A 1030A 1031A 1031A 1031A 1031A 1031A 1031A 1031A 1032A 1032A Level dB Low Frequ...

Страница 24: ...e due to Equalisation 7 6 5 4 3 2 1 0 1 2 1030A 1030A 1031A 1031A 1031A 1031A 1031A 1031A 1031A 1032A 1032A Level dB High Frequency RMS Deviation Before Equalisation 0 2 4 6 8 10 1030A 1030A 1031A 1031A 1031A 1031A 1031A 1031A 1031A 1032A 1032A Level dB High Frequency RMS Deviation After Equalisation 0 2 4 6 8 10 1030A 1030A 1031A 1031A 1031A 1031A 1031A 1031A 1031A 1032A 1032A Level dB High Frequ...

Страница 25: ...tion 0 2 4 6 8 10 12 S30D S30D S30D S30D 1037B 1037B 1037B 1037B 1037B 1038A 1038A 1038A 1038A 1038A 1039A Level dB Low Frequency 25 to 75 Percentile Difference Change due to Equalisation 4 5 4 0 3 5 3 0 2 5 2 0 1 5 1 0 0 5 0 0 0 5 S30D S30D S30D S30D 1037B 1037B 1037B 1037B 1037B 1038A 1038A 1038A 1038A 1038A 1039A Level dB Broadband 25 to 75 Percentile Difference After Equalisation 0 2 4 6 8 10 ...

Страница 26: ... 0 5 0 0 0 5 S30D S30D S30D S30D 1037B 1037B 1037B 1037B 1037B 1038A 1038A 1038A 1038A 1038A 1039A Level dB High Frequency 25 to 75 Percentile Difference Before Equalisation 0 2 4 6 8 10 12 S30D S30D S30D S30D 1037B 1037B 1037B 1037B 1037B 1038A 1038A 1038A 1038A 1038A 1039A Level dB High Frequency 25 to 75 Percentile Difference After Equalisation 0 2 4 6 8 10 12 S30D S30D S30D S30D 1037B 1037B 10...

Страница 27: ...tion 7 6 5 4 3 2 1 0 1 2 S30D S30D S30D S30D 1037B 1037B 1037B 1037B 1037B 1038A 1038A 1038A 1038A 1038A 1039A Level dB Low Frequency RMS Deviation Before Equalisation 0 2 4 6 8 10 S30D S30D S30D S30D 1037B 1037B 1037B 1037B 1037B 1038A 1038A 1038A 1038A 1038A 1039A Level dB Low Frequency RMS Deviation After Equalisation 0 2 4 6 8 10 S30D S30D S30D S30D 1037B 1037B 1037B 1037B 1037B 1038A 1038A 10...

Страница 28: ...n 7 6 5 4 3 2 1 0 1 2 S30D S30D S30D S30D 1037B 1037B 1037B 1037B 1037B 1038A 1038A 1038A 1038A 1038A 1039A Level dB High Frequency RMS Deviation Before Equalisation 0 2 4 6 8 10 S30D S30D S30D S30D 1037B 1037B 1037B 1037B 1037B 1038A 1038A 1038A 1038A 1038A 1039A Level dB High Frequency RMS Deviation After Equalisation 0 2 4 6 8 10 S30D S30D S30D S30D 1037B 1037B 1037B 1037B 1037B 1038A 1038A 103...

Страница 29: ...evel dB Low Frequency 25 to 75 Percentile Difference Before Equalisation 0 2 4 6 8 10 12 1036A 1036A 1036A Level dB Low Frequency 25 to 75 Percentile Difference Change due to Equalisation 4 5 4 0 3 5 3 0 2 5 2 0 1 5 1 0 0 5 0 0 0 5 1036A 1036A 1036A Level dB Broadband 25 to 75 Percentile Difference After Equalisation 0 2 4 6 8 10 12 1036A 1036A 1036A Level dB Low Frequency 25 to 75 Percentile Diff...

Страница 30: ...ifference Change due to Equalisation 4 5 4 0 3 5 3 0 2 5 2 0 1 5 1 0 0 5 0 0 0 5 1036A 1036A 1036A Level dB High Frequency 25 to 75 Percentile Difference Before Equalisation 0 2 4 6 8 10 12 1036A 1036A 1036A Level dB High Frequency 25 to 75 Percentile Difference After Equalisation 0 2 4 6 8 10 12 1036A 1036A 1036A Level dB High Frequency 25 to 75 Percentile Difference Change due to Equalisation 4 ...

Страница 31: ... 1036A 1036A Level dB Broadband RMS Deviation Change due to Equalisation 7 6 5 4 3 2 1 0 1 2 1036A 1036A 1036A Level dB Low Frequency RMS Deviation Before Equalisation 0 2 4 6 8 10 1036A 1036A 1036A Level dB Low Frequency RMS Deviation After Equalisation 0 2 4 6 8 10 1036A 1036A 1036A Level dB Low Frequency RMS Deviation Change due to Equalisation 7 6 5 4 3 2 1 0 1 2 1036A 1036A 1036A Level dB Fig...

Страница 32: ...036A 1036A Level dB Midrange RMS Deviation Change due to Equalisation 7 6 5 4 3 2 1 0 1 2 1036A 1036A 1036A Level dB High Frequency RMS Deviation Before Equalisation 0 2 4 6 8 10 1036A 1036A 1036A Level dB High Frequency RMS Deviation After Equalisation 0 2 4 6 8 10 1036A 1036A 1036A Level dB High Frequency RMS Deviation Change due to Equalisation 7 6 5 4 3 2 1 0 1 2 1036A 1036A 1036A Level dB Fig...

Отзывы: