4
Edit the name, and select .
Deleting a Location
1
Select
>
Locations
>
Saved Locations
.
2
Select a location.
3
Select
Delete
> .
Navigating to a Saved Location
Before you can navigate to a saved location, your device must
locate satellites.
1
Select
>
Locations
>
Saved Locations
.
2
Select a location.
3
Select
Go To
.
The compass appears. The arrow points toward the saved
location.
4
Select to start the timer and record the activity.
Navigating Back to Start
At any point during your activity, you can return to your starting
location. For example, if you are running in a new city, and you
are unsure how to get back to the trail head or hotel, you can
navigate back to your starting location.
Select an option:
• If the timer is still running, select
>
Back to Start
.
• If you stopped the timer and you have not saved your
activity, select
>
Back to Start
.
• If you stopped the timer and saved your activity, select
>
Locations
>
Back to Start
. The device navigates you to
the starting location of the last saved activity.
The compass appears. The arrow points toward your starting
point. If the timer is not running, you can start the timer again
to prevent the device from timing out to watch mode.
Stopping Navigation
Select
>
Stop Navigation
> .
ANT+ Sensors
Your device can be used with wireless ANT+ sensors. For more
information about compatibility and purchasing optional sensors,
go to
Pairing ANT+ Sensors
Pairing is the connecting of ANT+ wireless sensors, for example,
connecting a heart rate monitor with your Garmin device. The
first time you connect an ANT+ sensor to your device, you must
pair the device and sensor. After the initial pairing, the device
automatically connects to the sensor when you start your activity
and the sensor is active and within range.
NOTE:
If your device was packaged with an ANT+ sensor, they
are already paired.
1
Install the sensor or put on the heart rate monitor.
2
Bring the device within 1 cm of the sensor, and wait while the
device connects to the sensor.
When the device detects the sensor, a message appears.
You can customize a data field to display sensor data.
3
If necessary, select
>
Settings
>
Sensors and
Accessories
to manage ANT+ sensors.
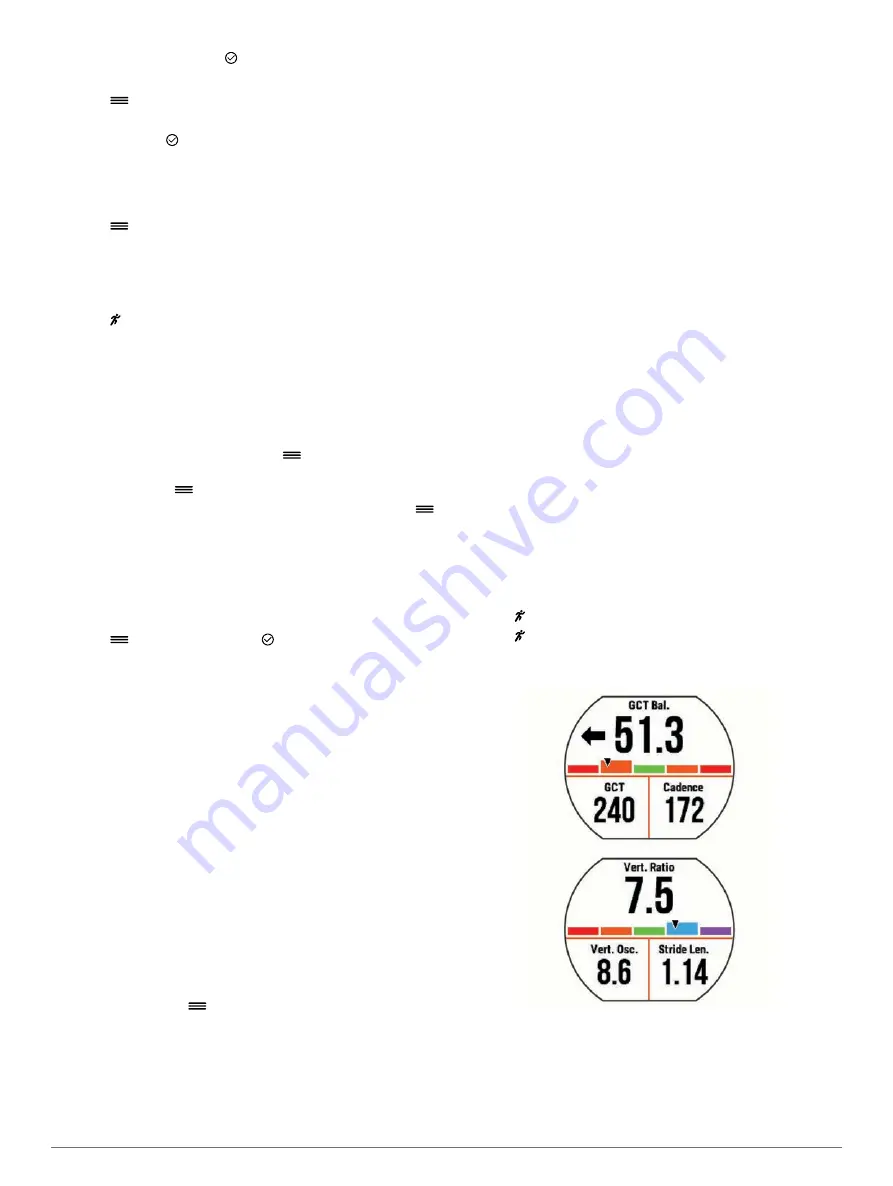
Running Dynamics
You can use your compatible Forerunner device paired with the
HRM-Run
™
accessory to provide real-time feedback about your
running form. If your Forerunner device was packaged with the
HRM-Run accessory, the devices are already paired.
The HRM-Run accessory has an accelerometer in the module
that measures torso movement in order to calculate six running
metrics.
Cadence
: Cadence is the number of steps per minute. It
displays the total steps (right and left combined).
Vertical oscillation
: Vertical oscillation is your bounce while
running. It displays the vertical motion of your torso,
measured in centimeters for each step.
Ground contact time
: Ground contact time is the amount of
time in each step that you spend on the ground while
running. It is measured in milliseconds.
NOTE:
Ground contact time is not available while walking.
Ground contact time balance
: Ground contact time balance
displays the left/right balance of your ground contact time
while running. It displays a percentage. For example, 53.2
with an arrow pointing left or right.
Stride length
: Stride length is the length of your stride from one
footfall to the next. It is measured in meters.
Vertical ratio
: Vertical ratio is the ratio of vertical oscillation to
stride length. It displays a percentage. A lower number
typically indicates better running form.
Training with Running Dynamics
Before you can view running dynamics, you must put on the
HRM-Run accessory or HRM-Tri
™
accessory and pair it with
your device (
).
If your Forerunner was packaged with the heart rate monitor, the
devices are already paired, and the Forerunner is set to display
running dynamics.
1
Select , and select a running activity profile.
2
Select .
3
Go for a run.
4
Scroll to the running dynamics screens to view your metrics.
5
If necessary, hold a data field to edit how the running
dynamics data appears.
Color Gauges and Running Dynamics Data
The running dynamics screens display a color gauge for the primary metric. You can display cadence, vertical oscillation, ground
contact time, ground contact time balance, or vertical ratio as the primary metric. The color gauge shows you how your running
dynamics data compare to those of other runners. The color zones are based on percentiles.
ANT+ Sensors
7
Содержание Forerunner 630
Страница 1: ...Forerunner 630 Owner s Manual November 2015 190 01954 00_0B ...
Страница 23: ......


