


SK-91F467D-208PFV V1.1
Getting Started
FMEMCU-UG-910014-10
- 46 -
© Fujitsu Microelectronics Europe GmbH
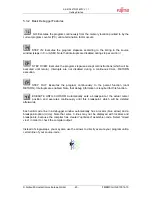
ABORT:
Forcibly terminates execution. This button is not fully supported by the
monitor debugger and may cause malfunction if used to abort “continuous
operation” of the MCU.
This command button can only be used to abort single code line operations
Example: for(k=DELAY_CONSTANT; k>0; k--);
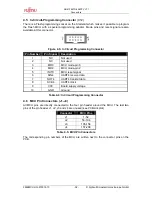
Use the
button INT0 on the “SK-91F467-xxx”
for
ABORT
function.
To
ABORT
continuous execution on the “SK-91F467-xxx” Starterkit, you have to
use the
INT0
button
on the “SK-91F467-xxx” Starterkit.
5.4 Advanced Softune Workbench Monitor Debugger Features
TOGGLE BREAKPOINT:
Sets or deletes breakpoint at the current source line
:
To set or delete a breakpoint, click the circles at the beginning of a source-line.
A indicates an active breakpoint. Hit “Run Continuously” to execute code until
reaching this line. A list of all breakpoints can be found under the “Debug – Breakpoint”
menu. 255 Software-Breakpoints (using TRAP replacement) are possible.
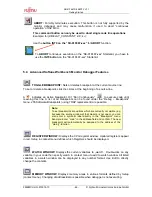
REGISTER WINDOW:
Displays the CPU-register window. Updated registers appear
in red.
Setup
in context menu defines which Registers should be displayed.
WATCH WINDOW:
Displays the current variables to „watch“. Double-click on any
variable in your code then specify
watch
in context menu to add to watch window. All listed
variables in a watch window can be displayed in any number format. Use
Edit
to directly
change the contents.
MEMORY WINDOW:
Displays memory areas in various formats defined by
Setup
(context menu). Changing of address/data is possible when debugger is not executing.
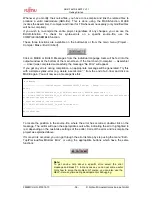
Note:
To set breakpoints at positions which are currently not visible (e.g.
because the source window of that module is not open), you can
also enter a symbolic label directly in the “Breakpoint” menu.
Example: Enter “main” in the address-field and confirm. The new
breakpoint will automatically be assigned to the address of the
“main()”-function.