


Lightmeter LM10
7.8. Graph and report
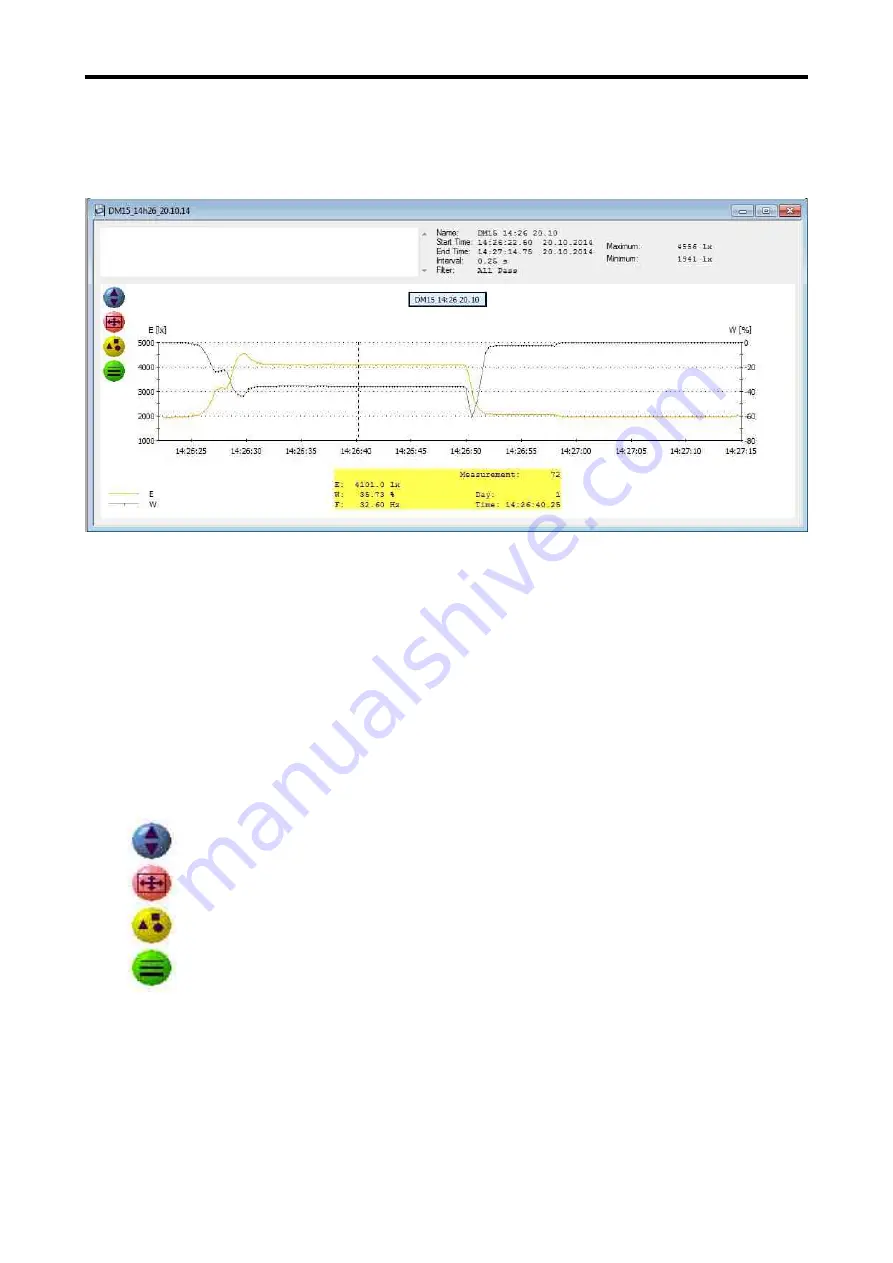
After loading the dataset of a long-term measurement the graphic window related to the dataset
opens.
On the right side in the top grey field, the most important information like the name of the dataset,
starting and ending time of the record, the measurement interval and the used probe are shown.
In addition, the maximum and minimum value are determined.
On the top left side, the text window serves to enter an own comment on the measurement like the
customer’s name, place of the measurement, special conditions etc.
The content of the comment field can be printed using the function
File/Print Report.
Now take the mouse pointer to the graphics area, a vertical bar follows the mouse pointer, under
the diagram the corresponding measurement time points and the respective measured values can
be read. The colours of the individual measurement channels are visible in the legends below to
the left.
On the left side of the diagram, four icons are located:
Hide and/or unhide the comment window.
Reset of the window’s zoom function.
For each measurement value, a point on the diagram curves is placed.
For the diagram’s curves, four different line widths are selectable.
To have a closer look at a moment in time in the diagram, perform a zoom. Move the mouse
pointer to the preferred starting timestamp, press the left shift-key and keep it pressed and move
the mouse pointer over the desired time to mark the zoom area.
Now release the left mouse button and the marked area is now zoomed to fit the whole window
width. If the Strg-key is pressed instead of the shift-key the area of thee Y-axis can also be
zoomed.
25


