Exinda Network Orchestrator
3 Using
|
185
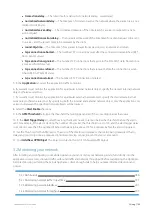
transaction-delay
— The total time for a transaction (network delay + server delay)
normalized-network-delay
— The time taken for data to traverse the network where the packet size is nor-
malized to 1024 bytes.
normalized-server-delay
— The normalized measure of the time taken for a server to respond to a trans-
action request.
normalized-transaction-delay
— The normalized measure of the time taken for a client request to be sent
to a server, and the server's reply to be received by the client.
round-trip-time
— The time taken for a packet to travel from a device, cross a network, and return.
tcp-connections-aborted
— The number TCP connections reset after the connection is established. (RST
from client or server)
tcp-connections-ignored
— The number TCP connections that expire in the SYN-SENT state. No response
is received from the server.
tcp-connections- refused
— The number TCP connections that are reset before the connection is estab-
lished. (RST in SYN-SENT state)
tcp-connections-started
— The number of TCP connections initiated.
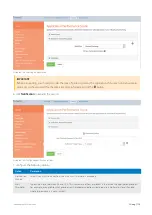
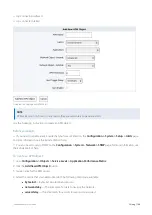
5.
In the
Application
list, select the application traffic to monitor.
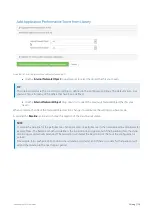
6.
If you want to just monitor the application for a particular internal network object, specify the desired internal network
object; otherwise select ALL.
7.
If you want to just monitor the application for a particular external network object, specify the desired external net-
work object; otherwise select ALL. By specifying both the internal and external network object, only the application con-
versations between the specified network objects will be tracked.
8.
Select the
Alert Enable
checkbox.
9.
In the
APM Threshold
field, type the threshold that will trigger an alert if the score drops below that value.
10.
In the
Alert Trigger Delay
list, select how long the metric needs to remain below the threshold before the alert is
sent. For example, if the alert is tracking the number of bytes lost, the threshold is set to 100, and the alert trigger delay
is set to 5 minutes, then the number of bytes lost needs to be above 100 for 5 minutes before the alert is triggered.
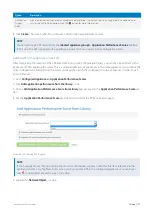
11.
Set the threshold for the APM metric. The units of the threshold is relative to the metric being measured. That is,
delays and round trip time are measured in milliseconds, tcp connections and bytes lost are counts.
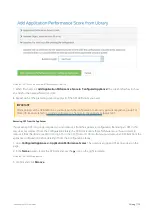
12.
Click
Add New APM Object
. The object is added to the list of configured APM objects.
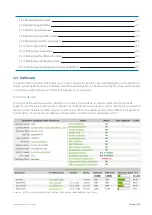
3.2 Monitoring your network
After installing and configuring your Exinda Appliance you can monitor your network, gaining full visibility into the
applications users access, inbound traffic, outbound traffic and network throughput. Before customizing the Optimizer,
best practices suggest letting the Exinda Appliance collect enough data to help you make informed decisions and
policies.
3.2.2 Monitoring network traffic in real time
3.2.3 Monitoring network interfaces
Содержание EXNV-10063
Страница 98: ...Exinda Network Orchestrator 2 Getting started 98 6 Click New The New Virtual Hard Disk wizard opens ...
Страница 99: ...Exinda Network Orchestrator 2 Getting started 99 7 Select VHDX as the Disk Format type and click Next ...
Страница 130: ...Exinda Network Orchestrator 2 Getting started 130 Screenshot 35 The life cycle of configuration status ...
Страница 369: ...Exinda Network Orchestrator 4 Settings 369 ...
Страница 411: ...Exinda Network Orchestrator 4 Settings 411 Screenshot 168 P2P OverflowVirtualCircuit ...
Страница 420: ...Exinda Network Orchestrator 4 Settings 420 Screenshot 175 Students OverflowVirtualCircuit ...
Страница 451: ...Exinda Network Orchestrator 4 Settings 451 ...

