Exinda Network Orchestrator
3 Using
|
205
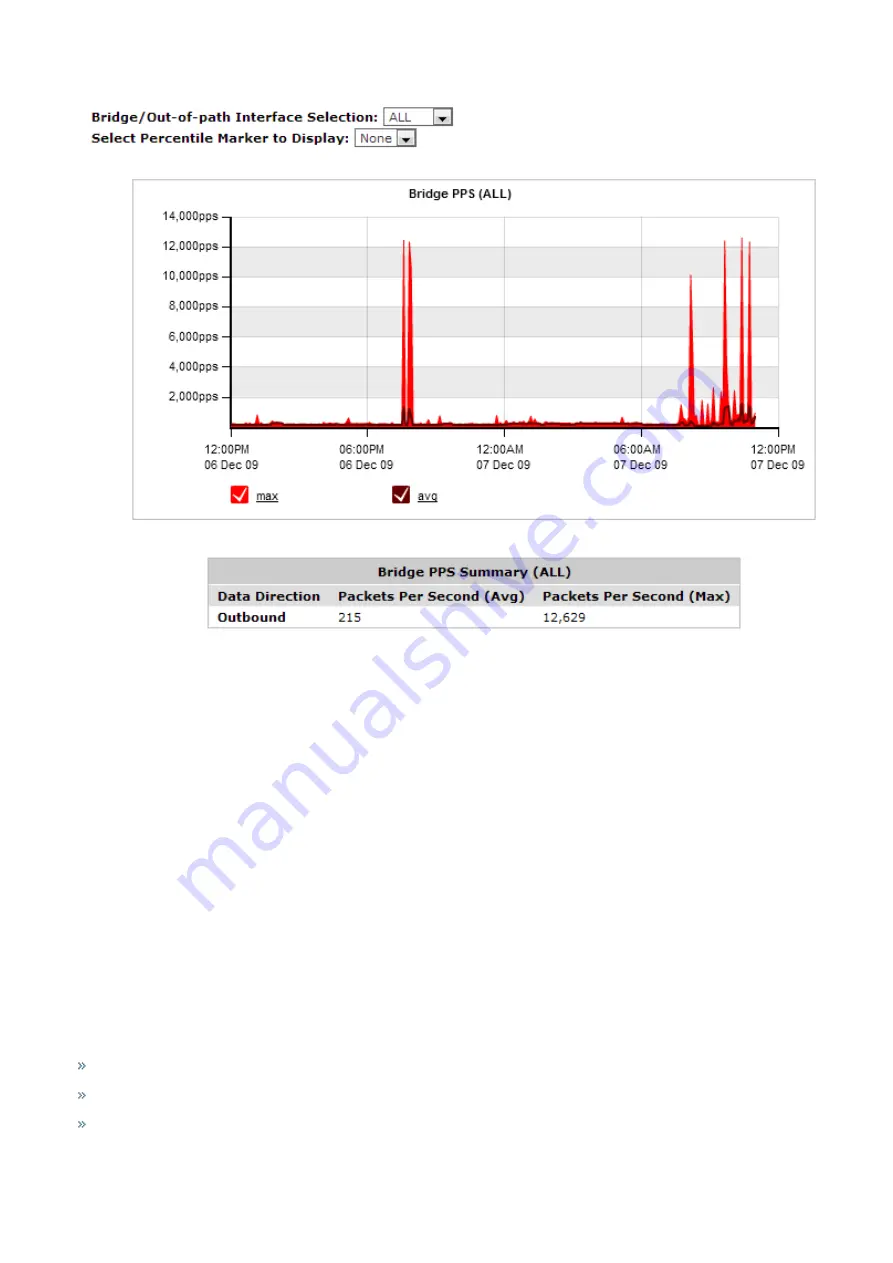
Screenshot 77: The Interfaces Packet Per Second report displays packet rates per second.
Where do I find this report?
Go to
Monitor > Interfaces > Throughput
.
To filter the data in the chart by bridge or out-of-path interface
Select the desired bridge (WAN interface), policy-based routing interfaces, or WCCP interface from the
WAN/Out-of-
path-Interface Selection
selector.
To identify which packet rate falls above a specific percentile
Select the desired percentile level from the
Select Percentile Marker to Display
selector.
3.2.4 Monitoring network throughput
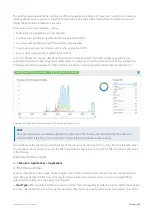
The Network Summary report shows traffic throughput over time by application, application groups, internal or external
hosts, internal or external users, conversations, or URLS. You can remove items from the chart to isolate traffic patterns and
sources.
This report answers questions such as:
What is the pattern of throughput for particular apps, app groups, users, hosts, etc.?
Are there any spikes and what type of traffic may be causing the spikes?
What would happen to the throughput if I created a policy to block a particular app, application group, user, or host?
The charts help you diagnose issues and perform what-if scenarios to determine the right size of your network.
Содержание EXNV-10063
Страница 98: ...Exinda Network Orchestrator 2 Getting started 98 6 Click New The New Virtual Hard Disk wizard opens ...
Страница 99: ...Exinda Network Orchestrator 2 Getting started 99 7 Select VHDX as the Disk Format type and click Next ...
Страница 130: ...Exinda Network Orchestrator 2 Getting started 130 Screenshot 35 The life cycle of configuration status ...
Страница 369: ...Exinda Network Orchestrator 4 Settings 369 ...
Страница 411: ...Exinda Network Orchestrator 4 Settings 411 Screenshot 168 P2P OverflowVirtualCircuit ...
Страница 420: ...Exinda Network Orchestrator 4 Settings 420 Screenshot 175 Students OverflowVirtualCircuit ...
Страница 451: ...Exinda Network Orchestrator 4 Settings 451 ...


