


EKO INSTRUMENTS CO., LTD Grating Spectroradiometer WISER Instruction Manual Ver.2
Pg. 36
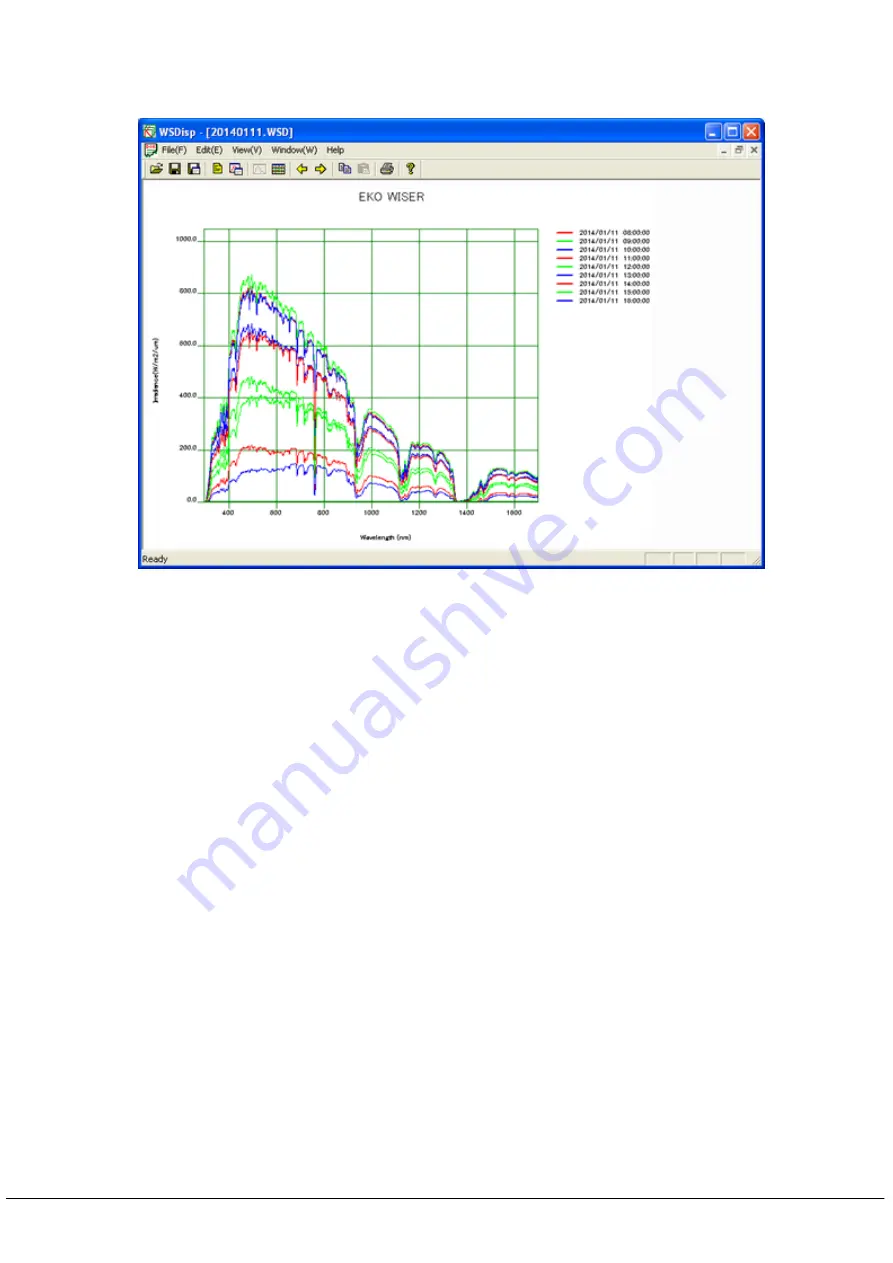
As the multiple data are selected, right click the mouse and select [Spectral Data] from the dropdown list.
The data are displayed in superimposed condition as shown on Figure 8-8.
There are 10 colors for graphing: Red, Orange, Yellow, Yellow Green, Green, Light Green, Light Blue, Blue,
Navy and Purple, registered as default colors. If more than 10 data are selected, the colors are repeated.
Graph colors can be freely changed by opening the WSDisp_V3.0.x.x.ini file as text editor and editing each
RGB values of the [COLOR TABLE]. Also by adding the number of lines, more than 10 colors can be
registered.
WSDisp_V3.0.x.x.ini File
:
[COLOR_TABLE]
#LINE_COLOR001=R,G,B
LINE_COLOR001=255,0,0
LINE_COLOR002=255,94,25
LINE_COLOR003=251,236,53
LINE_COLOR004=128,255,0
LINE_COLOR005=0,255,0
LINE_COLOR006=0,255,128
LINE_COLOR007=0,255,255
LINE_COLOR008=0,128,255
LINE_COLOR009=0,0,255
LINE_COLOR010=128,0,255
Figure 8-8. Superimposed Graph for Displaying Multiple Data
Содержание RoMiotto MS-711
Страница 1: ...Tel 11 3976 4003 3999 7737 vendas romiotto com br www romiotto com br...
Страница 51: ......