5
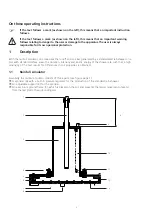
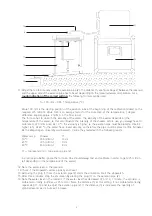
11.Adjust the rainfall intensity using the aeration pipe (2). The distance (h, see figure page 2) between the reservoir
and the upper side of the aeration pipe has to be set depending on the measured water temperature. For a
rough indication of the correct setting
, the following formula can be used.
h = 100 mm – 0.65 * temperature (°C)
Value 100 mm is the starting position of the aeration tube at the beginning of the calibration (closest to the
required 375 ml/min). Value 0.65 is an average factor for the correction of the temperature, 1 degree
difference equals approx. 4 ml/min in the final result.
The formula has to do with the viscosity of the water. The viscosity of the water depends on the
temperature of the water, so this can influence the intensity of the shower. Before use, you always have to
calibrate to 375 ml/minute. At 10 °C the viscosity is higher, so the aeration pipe must be placed a little bit
higher (>h). At 40 °C, the water has a lower viscosity, so therefore the pipe must be placed a little bit lower.
At the Wageningen University and Research Centre they tested with the following results:
Water temp.
Shower
h*
10 °C
350 ml/min-1
10 cm
20 °C
375 ml/min-1
9 cm
40 °C
450 ml/min-1
8 cm
h* = top reservoir (3) - top aeration pipe (2)
In practice you better ignore the formula. One should always test and calibrate in order to get 375 ml/min
(all depending on the temperature of the water).
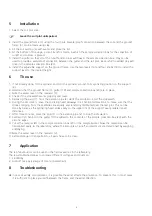
12.Note the water level in the reservoir.
13.Check if the stopwatch works properly and reset.
14.Removing the plug (1) from the aeration pipe (2) starts the simulation. Start the stopwatch.
15.After three minutes, stop the simulation by placing the plug (1) on the aeration pipe (2).
16.Note the water level in the reservoir. If the water level has decreased 375 ml in 1 minute, the sprinkler is
calibrated correctly (outflow = 375 ml/min). Note the distance (h) at this setting. If not calibrated correctly,
repeat step 11-16 and re-adjust the aeration pipe (2). If the distance (h) is increased, the quantity of
sprinkled water per minute will increase.
15
8
16
17
18
19
20
21
22

