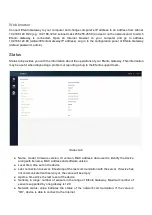
● Server: Information about the server to which the data is sent. If the value is “Efento”, it
means the the gateway sends the data to Efento Cloud
● Organisation token: value of the http token used to assign the gateway to an organisation in
Efento Cloud
● Server status: status of the communication with the server. If the value is “OK”, the device is
able to communicate with the configured server
Sensors
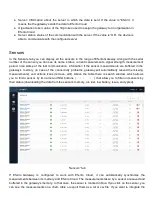
In the Sensors tab you can display all the sensors in the range of Efento Gateway. Along with the serial
number of the sensor you can see its name, status, current measurements, signal strength, measurement
period, time stamp of the last communication, information if the sensor measurements are buffered in the
gateway’s memory (in case of the connectivity problems, gateway will automatically resend the missing
measurements), and actions icons (remove, edit). Above the table there is search window, which allows
you to find a sensor by its name and filter buttons (
) that allow you to filter out sensors by
their status (downloading the data from the sensor's memory, ok, lost, low battery, issue, encrypted).
“Sensors” tab
If Efento Gateway is configured to work with Efento Cloud, it can automatically synchronise the
measurements between its memory and Efento Cloud. The measurements taken by a sensor are saved and
buffered in the gateway's memory. In that case, the sensor is marked in blue. If you click on the sensor, you
can see the measurements on a chart, table or export them as a txt or csv file. If you want to integrate the


