


User guide
AUDI
O
SMART
ECH001XN141-A4 – 07/2022
40
Chapter 5. The use of the software ECHOSOFT
5.7 Exploitation sur ECHOSOFT
5.7.2
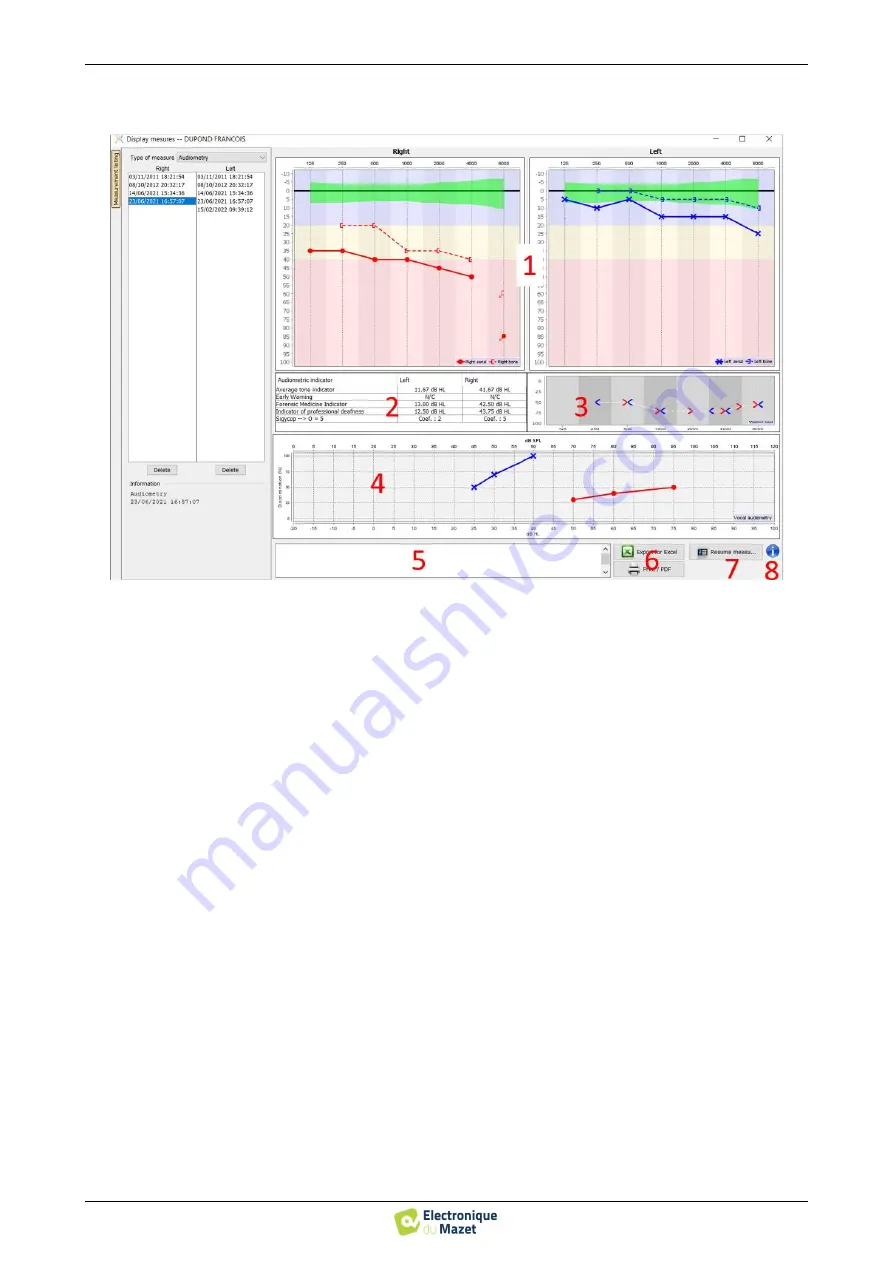
Description of the measurement window
1.
Display area of the
pure tone audiometry
graph:
•
Abscissa: frequency in Hz.
•
Ordinate: power in dB HL.
•
The blue curve with crosses is for aerial measurement on the left ear.
•
The red curve with circles is for aerial measurement on the right ear.
•
The dotted blue curve with brackets is for bone conduction measurement on the left ear.
•
The dotted red curve with brackets is for bone conduction measurement on the right ear.
•
The red dot with a bottom left arrow: the sound was played but the patient didn’t answer (right ear).
•
The blue cross with a bottom right arrow: the sound was played but the patient didn’t answer (left ear).
2.
Summary table of standard audiometric indicators.
3.
Weber
test display area.
•
Abscissa: frequency in Hz.
•
Ordinate: power in dB HL.
4.
Display area of the
Speech audiometry
graph:
•
Abscissa power in dB HL.
•
Ordinate: percentage of correctly repeated words.
•
The blue curve with crosses is for aerial measurement on the left ear.
•
The red curve with circles is for aerial measurement on the right ear.
•
The dotted blue curve with brackets is for bone conduction measurement on the left ear.
•
The dotted red curve with brackets is for bone conduction measurement on the right ear.
5.
Note input.
6.
• Excel export of the measurement,
•
Print options,
7.
If a device is connected, it is possible to resume the measurement,
8.
Information about the
AUDI
O
SMART
used for the measurement.


