


Operating and Maintenance Instructions
210-OMI14229-Iss8.1
CN1116 Full OMI
Page 11 of 47
© ebm-papst UK Ltd 2021
Chelmsford Business Park Chelmsford Essex CM2 5EZ
Telephone: +44(0)1245468555 Fax: +44(0)1245466336
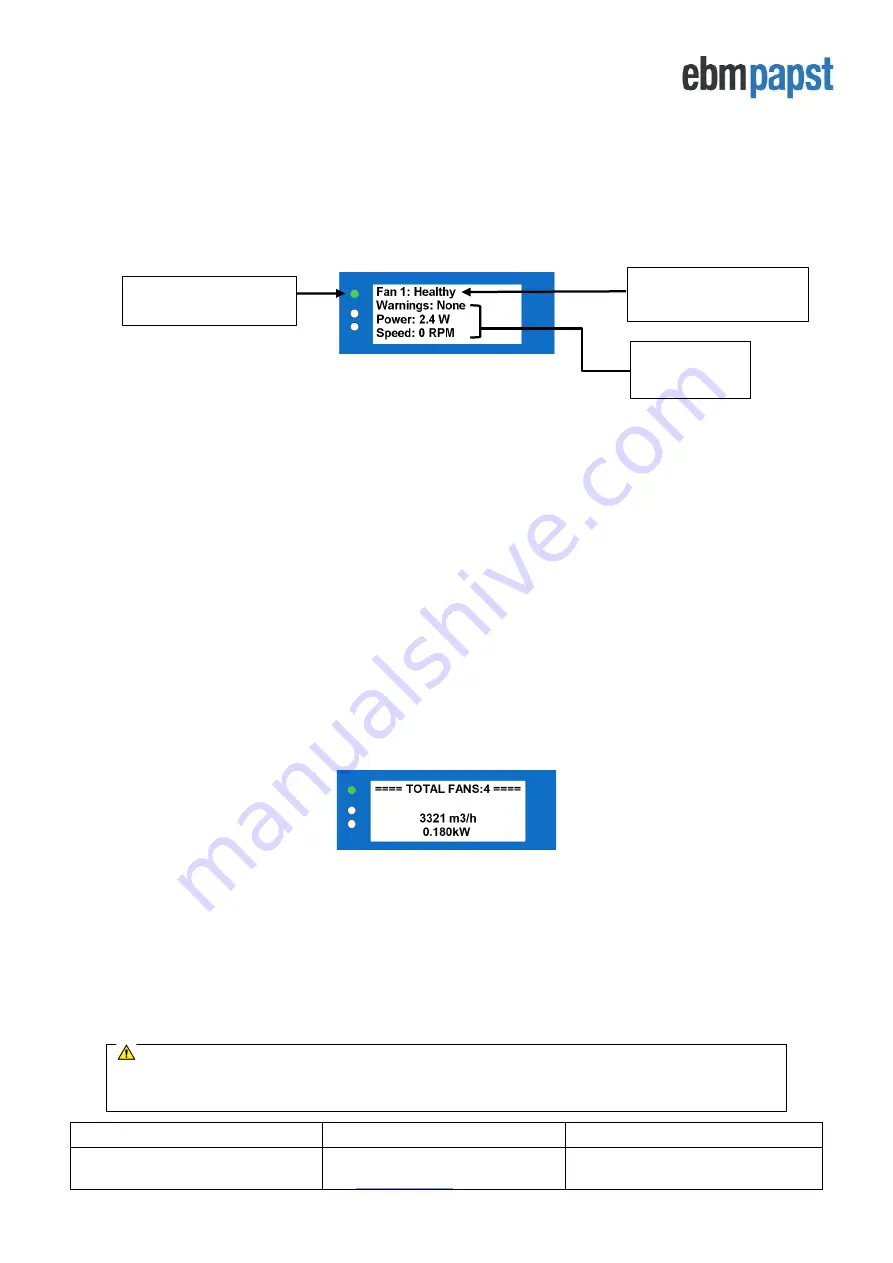
4.4 Fan status screen
When the controller has finished addressing all fans in the array, the
new fan array is saved in the controller’s non
-
volatile memory. For a large group of fans this may take some time as the controller must interrogate each individual
fan for their serial numbers. Once this process is
completed, a “Change Fan Address” prompt
screen will appear,
and in case it is desirable to swap fan positions in the network please see
These procedures only happen once per configuration, and the controller
will then default to ‘
M
onitor’
operating mode and the status screen of Fan 1 will be displayed as shown in Figure 6 below:
Figure 6 - Fan status screen
The following parameters are displayed for each fan in the network, three at a time:
•
Fan Condition
–
Healthy / Alarm / Warning / No Comms
•
Warnings
–
Description of warnings being experienced by the fan
•
Power
–
Power consumption (W)
•
Speed
–
Real-time fan speed (RPM)
•
Motor temperature -
o
C (not available for Modbus Lite reduced electronics fans)
•
Electronics Temperature -
o
C
•
Hours Run
–
Number of fan operational hours
•
Fan control - % of maximum input signal
•
Serial Number
–
Manufacturing serial number
•
Sensor Reading (available if the controller has been configured to work with multiple pressure sensors)
U
se the ‘UP’ and ‘DOWN’ buttons
to cycle between different parameters, and the BACK and ENTER buttons to
cycle between different fans.
4.5 Power meter and summary screen
The power meter and summary screen is accessible by pressing the ENTER button when displaying the status
screen of the last fan in the array. An example of a power meter and summary screen is shown in Figure7 below:
Figure 7
–
Power meter and Summary Screen
The top row has a summary text containing the number of fans in the system and the number of fans experiencing
alarms and/or warnings. The screen also shows the total volume/pressure of the system if one or more pressure
sensors have been installed and configured. In the example above, the real-time volume flow of the system is
shown in m3/h. If a volume/pressure alarm has been configured and triggered by the system, the second row will
change from blank to a
“Volume Alarm Active” or “Pressure Alarm Active” text
, the red LED status indicator will
switch on and (if configured) the alarm relay will open. The total power consumption of the system is shown in the
bottom row and consists of the sum of the power consumption from each fan converted to kilowatts.
Note:
If a fan experiences alarms, warnings or communication loss, the controller will remain in the
“
power
meter and summary
”
screen but will switch on the red LED (communication loss and fan alarms) and/or the
yellow LED (fan warnings).
Parameters
being monitored
All Fans Healthy:
Green LED on
Header with Fan Number
and Fan Condition


