background image

44

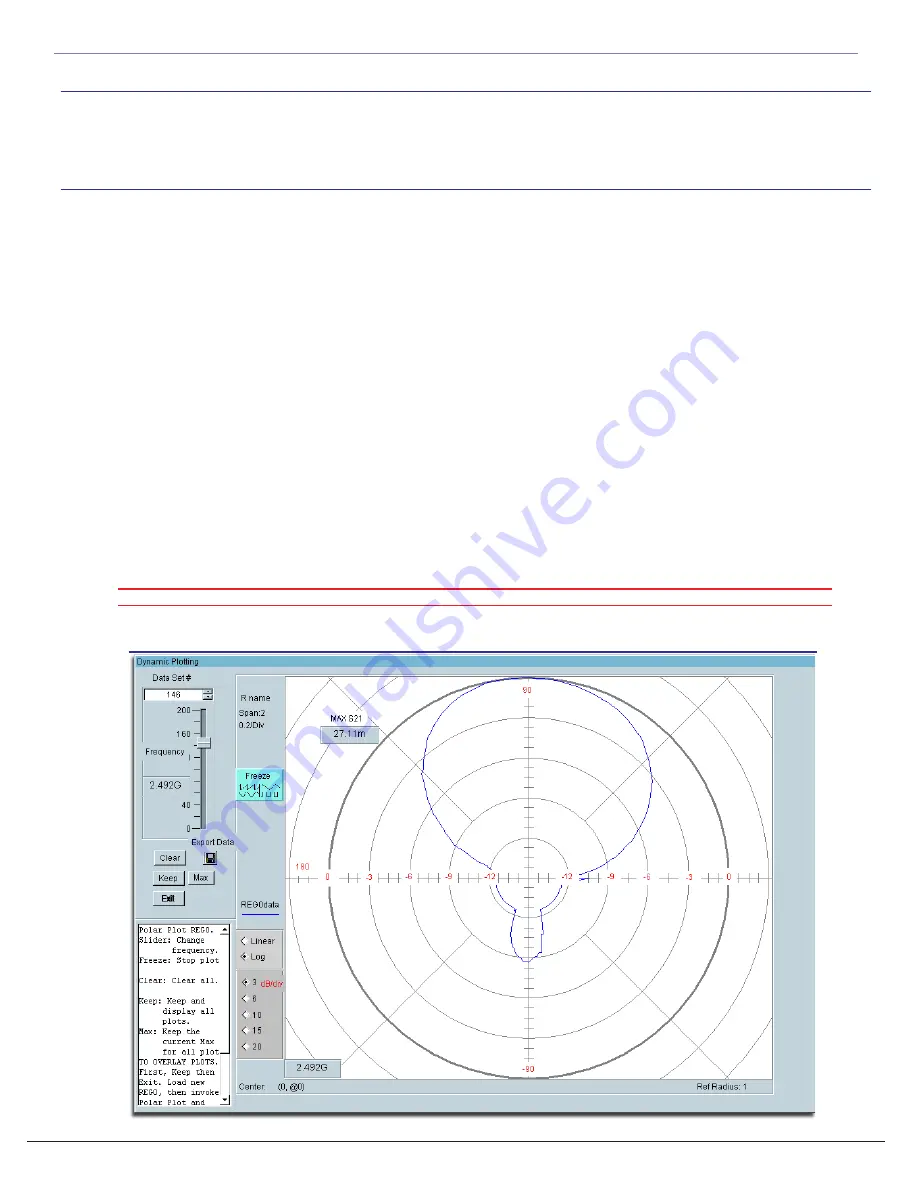
Viewing and working with the Polar Plot display

1. From the Main Data Processing Page click on “Polar Plot” and you will be taken to the screen
shown below

2. Select Log or Linear Data View.

3. Click “Auto Scale” to view all of the data

4. Slide the Frequency Slider to the desired frequency. (The plot will automatically update).

5. To Eliminate Flickering , Click the “Freeze” Button located on the left side of the plot. (NOTE: The
plot will not automatically update while the “Freeze” button is pressed”

6. Click the Export Data button if you want to export the data for the specific frequency to a file with
a user defined format.

7. You can change the dB/Div using the selction box in the lower left nad corner of the Plot window.

8. To Save a copy of the plot image you must use the Windows Screen Capture feature by pressing
the “Print Screen” button on your keyboard and pasting the copied image into Photoshop or other
image editing program.

Polar Plot Screenshot

Follow the Instructions below to view your data using the Polar Plot located in the Data Processing feature of the

software. Remember, The Polar Plot will only plot the data that is contained in the Active Register.

QUICK TIP

Right-Click the plot to see a list of visualization options such as zoom, and scaling functions.

Instructions:

Data Processing Feature

Chapter 4 - Using the Data Processing Feature

Содержание Officejet 6000

Страница 1: ...1 Desktop Antenna Measurement System Model 6000 ...

Страница 2: ...time to time in the content hereof without obligation of Diamond Engineering to notify any person of such version changes Trademarks IBM VGA and PS 2 are registered trademarks of International Business Machines AMD is a registered trademark of Advanced Micro Devices Inc Intel Pentium III 4Are registered trademarks of Intel Corporation Microsoft and Windows NT 95 98 ME 2000 XP are registered tradem...

Страница 3: ...erview 24 Measurement Settings 25 Receive Instrument Spctrum Analyzer Settings 25 Measurement Settings 26 Calibration Settings 27 Measurement Controls 28 Post Measurement Options 28 Meaurement Status and Displays 29 Data Processing Introduction 30 Data Registers 31 Visualization Options 32 Measurement Calculator 34 Dipole Link Simulator 34 Vertical Swing Correction 34 Chapter 3 Making Measurements...

Страница 4: ...4 ...

Страница 5: ...5 ...

Страница 6: ...l enable you to calculate the exact distance of the Test Antenna Identify Multipath rays and eliminate the need to use another measuring device Our software also allows you to export your data to a 3rd party application or spreadsheet This manual will fully assist you step by step with Assembling configuring and using the Desktop Antenna System To achieve the full functionality of the rotator syst...

Страница 7: ... Measurement Range A wide frequency use range allows for a more diversified range of antennas that can be tested with the system Rotary SMA Joint Using a custom developed Near Zero noise Rotary Joint the system can make accurate measurements without jeopardizing signal integrity Data Processing Feature Designed for post measurement processing you can perform a range of functions such as o Complete...

Страница 8: ... the following Insturments are are currently supported by the Standard DAMs Software VECTOR NETWORK ANALYZERS HP Agilent 8510 Series HP Agilent 8714 Series HP Agilent 8720 Series HP Agilent 8753 Series HP Agilent 5071 Series Wiltron Anritsu 46xx Series Analyzers Scorpion Rhode Schwarz ZVx Series SIGNAL GENERATORS HP 83650 Series HP 8350 Series POWER METERS Elva DPM 10 HP436A HP437B ML2438A antrits...

Страница 9: ...ew The USB Platform Control unit is a highly accurate Microprocessor based stepper controller Movement signals are sent from the measurment PC to the controller unit where precision stepping sequences are generated We also offer a development kit enabling you to write your own software to control the platform ...

Страница 10: ...tform Control unit controls the positioning of the Horizontal and Vertical movements based on signals recieved from the Computer s Parallel Port We also offer a Platfrom development kit which will allow you to adapt the DAMS Platform to your own software using a special DLL library System Overview ...

Страница 11: ...11 ...

Страница 12: ...Calibrated SMA measurement Cables 5 20 6 2m Parallel Cable 6 12v AC to DC wall adapter 7 Elevation Movement Assembly 8 Hex Wrench Tool 9 Elevation Mount Spacer Copy of your Order Not Shown Accessories 10 Digital Level Elevation Calibration Tool optional 11 Laser Alignment Tool Optional 12 Acrylic Thrust Plate assembled with platform Unpacking the System Chapter 1 Installation and Configuration Pac...

Страница 13: ... vertical mount spacer and snap it onto the very top of the tripod neck fig 2 Without this piece your unit will not make elevation measurements accuratly 3 atttach the vertical assembly onto the top of the tripod using the included hex wrench so the top edge of the vertical assembly is touching the bottom edge of the vertical spacer fig 3 Fig 1 Extend the Tripod Fig 2 Attach vertical Spacer Fig 3 ...

Страница 14: ...w Loosen screw after assembly 3 Align the colored piece of tape on the platform with the tape on the tripod head and insert the platform into the head at a 30 degree angle the head will automati cally lock the platform into position 4 Loosen the Tilt Lock Pic 2 enough to allow the platform to tilt and connect the vertical actuator rod to the platform tighten the locknut to ensure the rod does not ...

Страница 15: ...e Calibrated SMA cable to the bottom of the platform Step 4 Attach other end of SMA cable to your Analyzer USE CARE cable damage can compromise antenna results Step 5 Connect the straight end of the yellow cable with the black band on the connector to the Horizontal port on the Platform Controller and the non banded cable to the vertical port Step 6 Connect the other ends the yellow cables to the ...

Страница 16: ...e next page Installing the Software Chapter 1 Installation and Configuration Software and Hardware Installation Connecting the Controller and Installing the drivers Blue USB models Only 1 Connect the DAMS Platform Controller to the Computer using the included USB Cable A window should appear indicating that a new device has been found Do not select the option to automatically search for the latest...

Страница 17: ...s bellow to install the Userport sys Driver For additional Information Please read the Userport PDF located in the Userport Folder Step 2 Setting the Compatibility mode for VEE Runtime 6 0 XP PRO ONLY In order for the software to work absolutly correctly we reccomend setting the Windows XP compatibility mode to Windows 98 Me Mode for less chances of errors caused by the windows XP Kernel 1 Open My...

Страница 18: ... Sofware to communicate with your network analyzer 1 Click Start Programs Agilent VEE pro 6 0 Runtime I O Config 2 Turn on you Network Analyzer and Click the Find Instruments button 3 You should see your network analyzer appear in the list The instrument number consists of the GPIB controller ID number and the Instrument number Example ID newinstrument 1416 14 Nat inst GPIB controller 16 Analyzer ...

Страница 19: ... will fit onto the new trupod without angle or clearance problems Once you are ready to configure the software please read the DAMS Application note Tips and Tricks for a complete description and howto calibrate the vertical movement with a Tripod other than the one that was included with yourAntenna Measurement System If you needAssistance you are welcome to call or e mail us and we will be glad ...

Страница 20: ...rams DAMS DAMS x xx 3 Click the orange Manual Move button located in the upper left hand section of the software The platform should now horzontally move the number of times specified in the Total Number of Measurements window completing a 360 degree sweep 4 Set the Vertical Differential slider to a value of 5 degrees and press the green Manual Move button the platform should now move to 5 degrees...

Страница 21: ...lications running while the DAMs Software is operating Other Programs may cause the Platform to move inaccurately Reporting Bugs During some certain complicated untested scenarios a failure may occur If this happens Please let us know We will be able to address the problem and offer a hot fix faster if the error is reported Please send all errors and questions about software operation to support d...

Страница 22: ...22 ...

Страница 23: ...23 Chapter 2 ...

Страница 24: ...ngs NOTE These settings also apply for the RECEIVE ONLY instrument Start Stop Frequency Enter the frequency in GHz Decimals are ok example 450Mhz 45 Number of points Similar to a VNA configuration you may choose the number of frequency points for the sweep click the Freq Increments window to display the calculated Frequency Step Output Power Sets the output power of the Signal Generator format is ...

Страница 25: ...m analyzer sweep Inplut format is in MHz Trigger Mode Changes the way the power meter reads the sensor this setting is only applied to certain meters Trigger Delay This sets the delay Settling time between when the Signal generator is called and the power meter is queried for a reading format is in seconds Example 1 10 second 10 Sweep Delay this sets the number of seconds the signal generator will...

Страница 26: ...n setup Vertical Slider Use this slider to set the vertical angle that you would like the platform to move to Vertical Step size This sets the vertical measurement and movement resolution the default setting is 5 degrees per measurement but you can go as low as 1 degree if you wish Limit Check You have the option of having the software monitor the movement of the platoform to advise you if your se...

Страница 27: ...on invokes the power sensor cal menu NOTE If using a powe meter with Non Programmed sensor You MUST load or enter a Power Sensor cal table before performing a scalar calibration Power Sensor Calibration The Power Head Sensor calibration menu is located in the Scalar Calibration section Enter PM cal factors you can enter the calibration table directly to check compatibiliy Compile Array Compile the...

Страница 28: ... Accumulator When this button is pressed the software will begin making measurements by moving the platform horizontally then retrieving the data from the network analyzer The button will remain greyed out while the antenna measurement is in progress Move to Max Signal When this button is pressed the software will analyze the measurements you have jsut made to find the position where the antenna h...

Страница 29: ...measured Antenna High Res Plot Display a high resolution MatLab Polar plot of your measured Antenna at the Center Frequency Rotation Tracker This plot shows the current position of the platform the Horizontal Axis is shown with circular data points and the Vertical movement is shown with data points on the center plane of the plot Clear Plot Each plot has it s own Clear Plot button this will clear...

Страница 30: ...aking your initial measurement of the Antenna you can press the Data Procesing button located in the Post Measurement Options window of the main software page and you will be taken to the screen shown below This section of the manual will describe all of the functions located in the Data Processing feature Data Processing Chapter 2 Software Overview ...

Страница 31: ...urement Calculator which can pull data from any of the 5 registers Data Registers Data Storage Button When this button is pressed all of the data in the Active Register is stored to whichever storage button that you chose Recall Button When this button is pushed all of the data in the chosen storage register will be written to the active register for viewing or modification Load Reg 1 4 From Disc ...

Страница 32: ...ot for a more detailed view Features View entire data set at once Full Plot Rotation Zoom In Out feature Line and Notation Tools Exportable to common graphic formats Printable About After you make a Az El measurement you can view the Azimuth vs Elevation for any measured frequency using the Az El 3D Plot use the Azimuth Vs Frequency 3D plot to view frequency response to aid in the selection of of ...

Страница 33: ...om In Out About This plot offers a Linear or Log Polar 2D look into the Rotation Gain Pattern of the measured Antenna for a specified frequency point Features Linear or Log Format Scale Functions Automatically updates Keep Max Function Data Export Auto Scale Function Zoom In Out About This features allows the analysis of the Group Delay and Path Propogation Data you can also make an accurate measu...

Страница 34: ...o LOG the data before doing math If you select MAX or MIN then all measurement elements will be replaced with MAX or MIN This creates a normalization reference if you do your math correctly Dipole Link Simulator Vertical Swing Correction Chapter 2 Software Overview Data Processing The Diple Link Simulator is used to create ideal dipole measurements based on a set of physical and environmental fact...

Страница 35: ...35 ...

Страница 36: ...ed and plugged in 3 Turn Platform Power ON 4 Selet the Source Instrument you plan to use After selection click the Settings button located below the icon 5 Click the Cal System button 6 Connect the power meter to the top of the DAMs System 7 Press the left Begin Calibration button Follow on screen directions Chapter 3 Making Measurements System Calibration ...

Страница 37: ...Once the button has returned to its normal state you may enter the Advanced Processing section or perform other Post Measurement options Chapter 3 Making Measurements Basic Measurements Making a basic Vertical Elevation Measurement 1 Be sure Platform controller is turned on and connected 2 Attach antenna to rotator platform with SMA connector 3 Start the DAMS Software 4 On your analyzer select S21...

Страница 38: ... large files and may cause problems for some computers depending on resolution 7 Select your Direction using the CW CCW selection 8 Move the platform to the Elevation start position using the vertical slider and the Manual Move button If the vertical position of the platform does not match the software readout level the platform first Pg 9 Set the Vertical movement slider to the desited elevation ...

Страница 39: ...39 ...

Страница 40: ... using a large set of math operators as well as compare the current antenna to another Antenna or a calibrated refernece antenna A complete set of plotting options allow you visualize your data in a multitude of formats This section of the manual will assist you with getting the most out of your Antenna Measurement System If you are not familliar with any of the terms mentioned in this chapter ple...

Страница 41: ... button labled Data Storage Reg 1 this will place all of the active register data into Data Storage Register 1 and cause a red to be places next to that data register To save this data set to the hard drive you would press the Save Reg 1 4 to disc button Data Storage Button When this button is pressed all of the data in the Active Register is stored to whichever storage button that you chose Recal...

Страница 42: ...f the storage registers or make a Measurement 2 You can only view 1 frequecy at a time using the Az El 3D Plots when you press the View 3D Az El measurements you will be prompted to choose a frequency to view 3 Depending on the size of your measurement and the speed of your computer it may take up to 2 minutes for your 3D plot to appear on the screen QUICK TIP Use the Amplitude plot to get a refer...

Страница 43: ...ile with a user defined format 7 To Save a copy of the plot image you must use the Windows Screen Capture feature by pressing the Print Screen button on your keyboard and pasting the copied image into Photoshop or other Dynamic Amplitude Plot Screenshot Follow the Instructions below to view your data using the Dynamic Amplitude Plot located in the Data Processing feature of the software Remember T...

Страница 44: ...ency to a file with a user defined format 7 You can change the dB Div using the selction box in the lower left nad corner of the Plot window 8 To Save a copy of the plot image you must use the Windows Screen Capture feature by pressing the Print Screen button on your keyboard and pasting the copied image into Photoshop or other image editing program Polar Plot Screenshot Follow the Instructions be...

Страница 45: ...creenshot Linear When highlighted the Reg to the right is to be used as S21 in vector format Arithmetic is performed using vector components LinearMag When highlighted the Magnitude of Reg to the right is to be Logged dB and used as a scalar array in all arithmetic operations The angle information is remains in the original Reg but is lost in the calculator LOGmag When highlighted the Reg to the r...

Страница 46: ... operate on only the data from the first set left of the Any magnitude values LESS that the clip value will be set EQUAL to the clip value Notice the plotting functions will be affected by the clip value Use this to scale and expand the plots Notice also that the calculator can be used to change the plot scales from linear to log or to add offset to measurements TERM 1 MULTIPLIER Works with LINEAR...

Страница 47: ...ce delimited data files were originally established for S Parameter measurements and are still the standard today A space delimited file is easily copied and paste into a spreadsheet word processor or text editor Microwave Office and Agilent both use the original Touchstone format established by Compact Engineering in the 70 s This program is a universal data exporter It may be used for any proper...

Страница 48: ...or basic Antenna rotation measurements the frequency is constant while the path loss and angle is the program measurement complex variable Adata I you wanted to create a text based output file for a spreadsheet which contains the results of a rotation and measurement set then set all switches tothe up position except for switch 2 or 3 or 4 or 5 Then enter Adata into window 2 below switch 2 Press t...

Страница 49: ... hole area is inversely proportional to frequency or 1 f 2 in power After each calculation return to the advanced menu and store the results into Re1 and Reg2 Note that these results are linear power If you are planning to compare your link measurements to this ideal dipole link then you need to set the frequency and rotation start stop step to the same values Set the PTx dBM to your VNA power DAM...

Страница 50: ...gives the entire path gain over Tx rotation and frequency THE Rx Aperture If the Rx antenna is isotropic GRx 1 then the Calculate Rx Aperture is the receive power for two isotropic radiators one Tx and one Rx at distance R It is as the figure above except that each dipole is replaced with an ideal infinitesimal isotropic antenna where the Tx radiator is fed with the PTx power converted to linear A...

Страница 51: ... in the group delay plot Non periodic spikes represent the Multipath or some other source of distortion Be advised this software does not perform vector corrections for free space measurements The corrected group delay is applied only toThe display Use the EXPORT button on the display to save the display values to disc Note that if you made measurements and saved them to the disc or into a Reg tha...

Страница 52: ...52 ...

Страница 53: ...53 ...

Страница 54: ...een movement assembly and the rotator platform Bad software installation Solution Disconnect and re connect movement cable to verify correct insertion Re install rotator software Problem Running WinNT 2000 XP Pro it comes up with a red window indicating that a serious error has occurred Possible Causes Userport sys is not installed Solution Install Or Re Install the UserPort sys Driver Problem Ana...

Страница 55: ... ever need a replacement part for your rotator unit Please call us or e mail us for faster response and pricing information Most Repairs are covered under warranty except for damages resulting from obvious abuse or misuse of the product Contact Information Visit us on the Web at Http www DiamondEng net Main Headquarters Diamond Engineering P O Box 2037 Diamond Springs CA 95619 Phone 530 626 3857 F...

Отзывы: