


U
S I N G
T H E
S
O F T W A R E
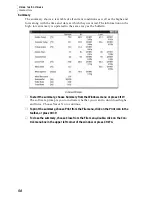
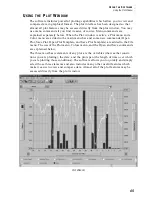
Using the Plot Window
72
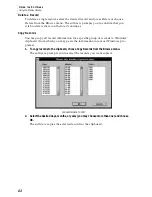
5. To return to normal plot operation, Choose Overlay from the Plot menu (or press F9) to
open the Overlay dialog box and choose Overlay Off.
The software returns you to the Plot window. The only date plotted will be the
top date from the Plot Dates list.
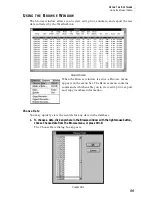
Plotting Data from the Previous Year (Last Year)
The software can quickly compare plotted data to data for the same period from
the previous year. For example, if you are viewing a 3-day plot span starting on
March 1, 1997, this feature will quickly show you, on the same plot, the data for
March 1, 1996.
Note:
Obviously, you cannot use this feature unless you have data from a previous year in your data-
base.
▲
To view previous year’s data, choose Last Year from the Plot menu or press F10.
The software plots data for the previous year. Note that the span button and
the zoom icons disappear (you may not zoom in/out, change plot spans, or
view details while viewing last year’s data) and the axis info buttons now dis-
play date information instead of variable information. While viewing last
year’s data, you may scroll the date using the scroll bar or left/right arrow
keys. You may also change the variable you are plotting by choosing a new
variable from the variables box or Add/Remove sub-menu, or by pressing the
up/down arrow keys.
▲
To remove the previous years’ data, choose Last Year from the Plot menu or press
F10 again.
The software removes the second date and returns you to normal Plot opera-
tion.
Clear Entire Plot
To clear all variables from the plot (giving you a blank plot to work with), click on
the Clear Plot icon (next to the Title Bar) or choose Clear Plot from the Options
sub-menu in the Plot menu.
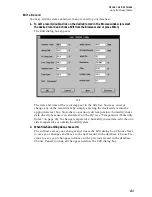
Saving and Opening Plots and Plot Templates
The commands added to the File menu when the Plot window is active allow you
to save and open plots and plot templates. When you save a plot, all information
is stored, including the date of the data currently plotted. When you open that
plot, it automatically loads all variables and settings to restore the plot to the exact
way it looked when you saved it. When you save a plot template, all information
except for the date is stored. When you open a plot template, the software loads
all variables and settings, but plots the data from whatever date is currently being
viewed.
▲
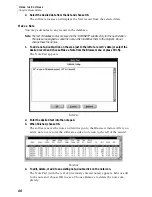
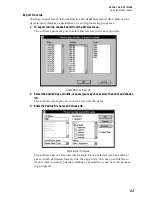
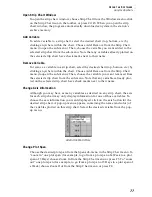
Open Plot
To open a previously saved plot, choose Open Plot from the File menu. Select
the desired plot in the Open dialog box and choose OK.
▲
Save Plot
To save a plot, choose Save Plot from the File menu or press Ctrl-S. Enter the
desired file name and choose OK.


