Graph Mode
Vantage Pro Console Manual
Page 39
G
R A P H
M
O D E
The Vantage Pro Console features a powerful graphing facility. Using this
mode, you may view over 100 graphs of different kinds - all without connect-
ing to a personal computer.
Table 2 above details the graphs that the Vantage Pro Console can display. Note
especially that different weather variables may have different graphs available.
(Some graphs require optional sensors. See above for details.)
Entering and Exiting Graph Mode
• Press the “GRAPH” key to enter graph mode
You’ll know you’re in graph mode because only the date field, graph,
graph mode indicator (See “Display Features” on page 19.) and the cur-
rently selected variable will be lit. The rest of the screen will be blank.
• Press the “DONE” key to exit the graph mode
Using and Understanding the Graph Mode’s Features
Although the available graphs vary, depending on what weather variable
you’re plotting, you view each graph the same way.
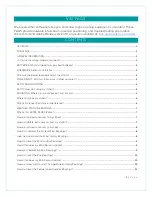
Содержание and Vantage Pro
Страница 1: ......
Страница 2: ......
Страница 40: ...Chapter 3 Page 40 Vantage Pro Console Manual...
Страница 46: ...Troubleshooting Page 46 Vantage Pro Manual...
Страница 55: ...Page 55 Vantage Pro Manual...
Страница 56: ...Page 56 Vantage Pro Manual...
Страница 57: ...Page 57 Vantage Pro Manual...
Страница 58: ...Page 58 Vantage Pro Manual...