background image

Graph Mode

34

The horizontal axis is time, showing the current and last 25 intervals (hours, 
days, months, or years). The vertical axis scale changes automatically to fit the 
information of the period graphed.

Viewing Graphs

Although the graphs available may 
vary for each weather variable, all 
are displayed in the same way.

1.  Select a variable to graph.
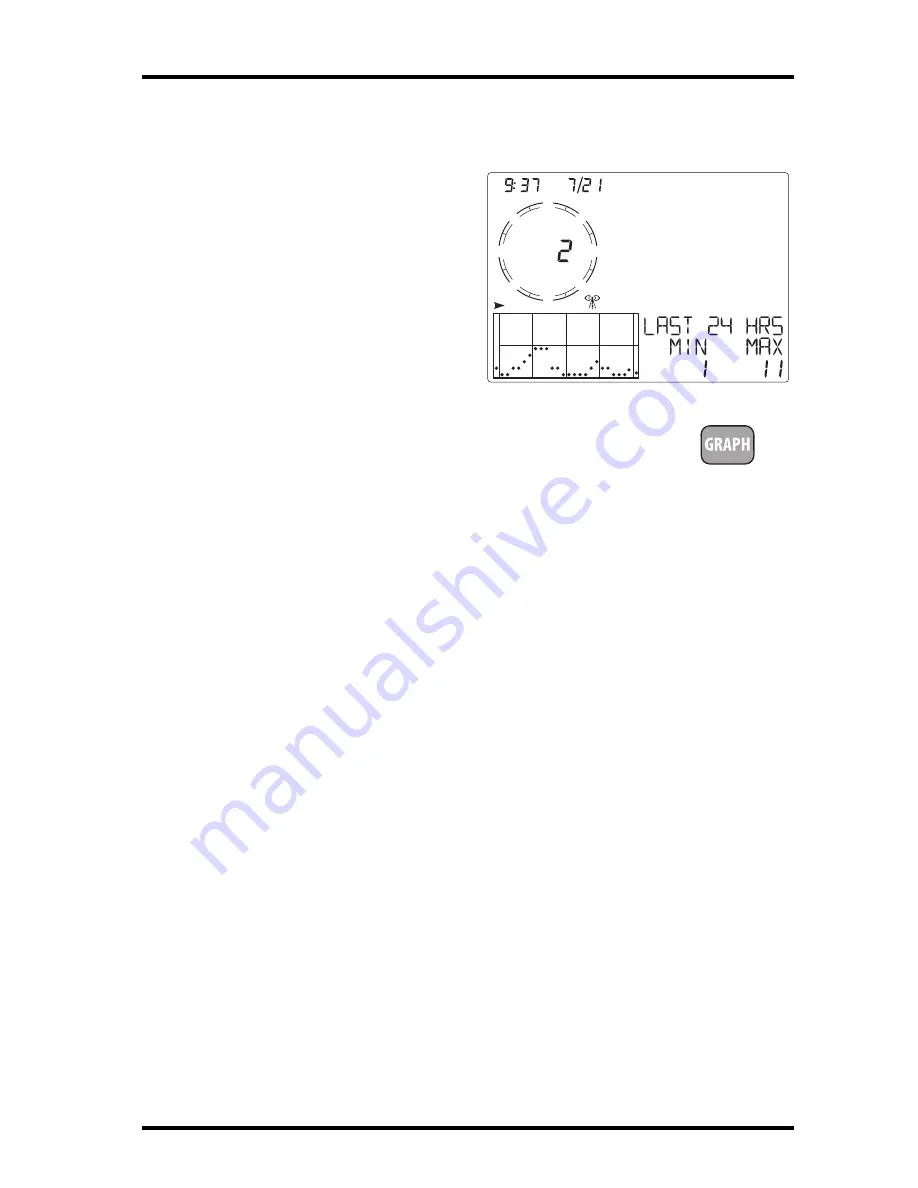
2. Press GRAPH to enter Graph Mode. Only the time, date, 

graph, graph icon, selected variable and information 
pertaining to the selected variable are visible. The rest of 
the screen is blank.
Values for the present time and each of the preceding 25 hours are displayed 
in the graph, each hour represented by a dot. The dot at the right end of the 
graph is the value for the current hour. You’ll notice that the dot is blinking. 
The dot at the left end of the graph is the value at least 24 hours ago. 

3. Press the < key and the second dot from the right starts to blink. 

The screen displays the new dot’s value. The time display shows what hour 
is being viewed. 

4. Press the < and > keys to view the variable’s high values for each of the last 

25 hours. 

5. Press the + and - keys to shift the graph’s time span.

If you press the - key, the graph shifts from the current and last 25 hours to 
the current and last 25 days. Each dot represents the high recorded on the 
day shown in the date field. To see the lows recorded in the current and last 
25 days, press HI/LOW. Press the < and > keys to move between days. 
By pressing the -


key again, the graph shifts to show the highs of the current 

and last 25 months. As before, use the < and > keys to move between 
months. Press HI/LOW to shift between the highs and lows.
By pressing the -


key again, the graph shifts one more time to show the 

highs of the current and last 25 years, but only for Rain Rate, Rain, and ET.
Since the console only graphs data collected by the station, graphs can only 
show data collected since the station was installed.

WIND

GRAPH

MPH

am

N

S

W

E

NE

SE

NW

SW

Graph Mode for the wind variable

GRAPH

Содержание Vantage VUE

Страница 1: ......

Страница 2: ...ions may cause harmful interference to radio communi cations However there is no guarantee that interference will not occur in a particular installation If this equipment does cause harmful interferen...

Страница 3: ...smitters 8 Screen 6 Configuring Transmitter IDs 9 Screen 7 Retransmit 10 Screens 8 and 9 Latitude and Longitude 10 Screen 10 Elevation 11 Screen 11 Barometric Reduction Setting 11 Screen 12 Wind Cup T...

Страница 4: ...cial Alarms 32 Setting Alarms 32 Setting the Time Alarm 33 Clearing Alarm Settings 33 Silencing Alarms 33 Changing Alarm Sound 33 Graph Mode 33 Viewing Graphs 34 Troubleshooting and Maintenance 36 Van...

Страница 5: ...led weather information available for each variable The keyboard consists of 12 command keys and four navigation keys A weather variable or console command is printed on each command key Just press a...

Страница 6: ...nsole See Current Weather Mode on page 15 for information on displaying current weather information See Troubleshooting and Maintenance on page 36 for information on trouble shooting console issues an...

Страница 7: ...ID Replace the battery in your outdoor Integrated Sensor Suite ISS or any optional transmitting station you may have added Installing Batteries 1 Remove the battery cover located on the back of the c...

Страница 8: ...accessible and the display is easy to read For more accurate readings follow these suggestions Avoid placing the console in direct sunlight This may cause erroneous inside temperature and humidity re...

Страница 9: ...e two keyholes are used to hold the console kickstand in place and two 6 x 1 pan head self threading screws included in the hardware kit To mount the console on a wall 1 Use a ruler to mark two mounti...

Страница 10: ...nds to enter exit and navigate Setup Mode Enter Setup Mode by pressing and releasing 2ND and then SETUP Press DONE to move to the next screen in the Setup Mode Press BAR to display the previous screen...

Страница 11: ...types To choose between a MM DD or DD MM display for the date first select either the day or month setting then press 2ND and immediately press UNITS This switches the console from one date display to...

Страница 12: ...aylight saving status or to set daylight saving manually 1 If the daylight saving setting is MANUAL press the and keys to turn daylight saving time on or off on the appropriate days of the year This w...

Страница 13: ...s default transmitter ID 1 Press the and keys to select a transmitter ID When you select a transmitter ID 1 8 the ID number is displayed on the screen as well as its current configuration OFF VUE ISS...

Страница 14: ...e Make a note of the ID selected for retransmit and the transmitter type ISS VP2 WIND the console is retransmitting Make sure the console that is receiving the retransmitted data is configured to the...

Страница 15: ...d keys to move from one value to another 2 Press the and keys to adjust a numeral up or down 3 To switch between feet and meters press 2ND then press UNITS 4 If your location is below sea level such a...

Страница 16: ...Transmitter IDs on page 9 for more information The Wind Cup Type screen contains three options LARGE SMALL or OTHER In most Vantage Pro2 anemometer or ISS Installations LARGE is the cup type that is s...

Страница 17: ...gree day is used to determine the amount of energy or fuel used to keep a structure like your home or business cool A heating degree day is used to determine the amount of energy or fuel used to keep...

Страница 18: ...ss 2ND and then clear The value changes to dashes Note If a base temperature is displayed degree day data is being accumulated If the value shows dashes the degree day function is off and will not app...

Страница 19: ...nto service The Clear All command clears all stored high and low weather data including monthly and yearly highs and lows and clears the alarm settings The command is recommended to properly clear the...

Страница 20: ...the screen for eight seconds Key secondary functions are enabled during this time The keys return to normal operation after the icon disappears Select a variable and press WxCEN to display informa ti...

Страница 21: ...forecast icons and descriptions of the forecasted weather they represent Note See Screen 1 Time Date on page 7 to change the console time and date or to select a 12 or 24 hour clock Wind Speed and Di...

Страница 22: ...peed was recorded Last 10 Minute Gust Displays the high wind gust in the last 10 min utes with the direction of the highest gust displayed in degrees Average Wind Speed Displays the average speed over...

Страница 23: ...d and the temperature recorded at the same time the day before Updated on the hour Temperature Change Per Hour Displays the difference between the temperature currently recorded and the temperature re...

Страница 24: ...easure ment for the day and the time it was recorded 3 Press HUM a second time to select inside humidity 4 Press WxCEN to display the information available for inside humidity in the Weather Center Co...

Страница 25: ...e the same if the altimeter setting was selected See Screen 11 Baro metric Reduction Setting on page 11 for more information Absolute Pressure Displays the barometric pressure that would dis play if N...

Страница 26: ...erature related weather variable is changed the unit of measure also changes for all temperature related variables See Inside and Outside Temperature on page 18 for more information The console uses t...

Страница 27: ...rded Heat Index Heat index outside only shares the same section on the console as wind chill and dew point below the barometric pressure variable next to the wind compass rose Press 2ND then press HEA...

Страница 28: ...ure 5 Press WxCEN to display the weather information available for all of the rain variables in the Weather Center 6 Press WxCEN multiple times to scroll through the rain related Weather Center screen...

Страница 29: ...ding 3 Press and release 2ND then press ET a third time to display the evapotranspiration reading since January 1st of the current year 4 Press WxCEN to display the weather information available for a...

Страница 30: ...urrently displaying on the console screen The key lightens the segments currently displaying on the console screen Adjust the contrast as desired Note The step changes are subtle You may need to press...

Страница 31: ...the factory to be accurate when the solar panel above it is pointing south If your solar panel does not point south you must use this procedure to correct the wind direction In any case you can also u...

Страница 32: ...ress and release 2ND and then press and release SET to display the RAIN ERROR IN PERCENT screen 4 Press the and keys to add or subtract from the percent amount A positive percentage rate adds a certai...

Страница 33: ...als Clear the daily rain total if the station accidentally recorded rain when the ISS was installed or after routine cleaning and maintenance Monthly rain Clears the monthly rain total Does not affect...

Страница 34: ...hs and lows Viewing Highs and Lows 1 Press HI LOW to enter the Highs and Lows Mode The day of the week and DAILY HIGHS display in the Weather Center section of the console and the console displays the...

Страница 35: ...d off depending on the screen displaying If dew point is selected neither wind chill nor heat index will be displayed Alarm Mode The Vantage Vue features 22 alarms that can be programmed to sound when...

Страница 36: ...arm is updated every minute Setting Alarms 1 Press and release 2ND then press ALARM to enter the Alarm Mode to view or set the high alarm thresholds The screen displays the current high alarm threshol...

Страница 37: ...current time 3 Press the and keys to select between the hour digit and the minutes digits 4 Press the and keys to change the digit s value up and down To change between AM and PM keep pressing and wh...

Страница 38: ...ight starts to blink The screen displays the new dot s value The time display shows what hour is being viewed 4 Press the and keys to view the variable s high values for each of the last 25 hours 5 Pr...

Страница 39: ...vailable Graphs Hourly Daily Monthly Yearly Barometric Pressure C H L H L Humidity Inside C H L H L Humidity Outside C H L H L Dew Point C H L H L Rain T T T T Rain Rate H H H H ET optional T T T T In...

Страница 40: ...ow 32 F 0 C Use an external temperature sensor in low temperature locations or install the console indoors Display locks up Reset the console by removing AC and battery power then restoring power If t...

Страница 41: ...d away from radiant heat sources See the ISS Installation Manual Inside temperature sensor reading seems too high Turn off console backlight Move the console out of direct sunlight Make sure the conso...

Страница 42: ...n how to check the station for potential transmission problems Console Diagnostic Mode In addition to logging weather data the console continuously monitors the station s radio reception You may find...

Страница 43: ...and are discarded These are considered bad packets This also includes the CRC errors received during radio acquisition 4 The firmware version currently installed on the console 5 Maximum number of ba...

Страница 44: ...frequency correction is added This value affects the value of 3 3 Current frequency correction factor Shows the frequency adjustment to the console 4 Signal strength of the last packet received The v...

Страница 45: ...mware View the firmware version in Value 4 in the Statistical Diagnostic screen or by pressing and holding DONE and from the Current Weather Mode screen You can check the firmware version currently av...

Страница 46: ...justment elsewhere The console also displays the sunrise and sunset times based on the latitude and longitude time and date and your time zone UTC offset Moon Phases The moon phase icons and moon phas...

Страница 47: ...d and direction and is part of the Integrated Sensor Suite ISS The console calculates a 2 minute average wind speed a 10 minute average wind speed and 10 minute dominant wind direction The 2 and10 min...

Страница 48: ...y When we use the term humidity in the manual and on the screen we mean relative humidity It is important to realize that relative humidity changes with temperature pressure and water vapor content If...

Страница 49: ...sed to predict the formation of dew frost and fog If dew point and temperature are close together in the late afternoon when the air begins to turn colder fog is likely during the night Dew point is a...

Страница 50: ...tion from wet surfaces with the amount of water vapor returned through transpiration exhaling of moisture through plant stomata to arrive at a total Effectively ET is the opposite of rainfall and it i...

Страница 51: ...ths approximately Housing Material UV resistant ABS plastic Console Display Type LCD Transflective Display Backlight LEDs Dimensions Console with antenna on table 7 5 x 5 75 x 4 5 190 mm x 146 mm x 11...

Страница 52: ...le selected Graph Time Span 26 Intervals Current interval plus 25 past values included see Graph Intervals to determine time span Graph Variable Span Vertical Scale Automatic varies depending upon dat...

Страница 53: ...03 Hg 0 8 mm Hg 1 0 hPa 1 0 mb Barometric Trend 3 hour Change Rates Rapidly 06 Hg 1 5 mm Hg 2 hPa 2 mb Slowly 02 Hg 0 5 mm Hg 0 7 hPa 0 7 mb 5 Arrow Positions Rising Rapidly Rising Slowly Steady Falli...

Страница 54: ...thly Yearly to 199 99 1999 9mm greater of 5 or 0 01 0 25 mm Solar Radiation 1 W m2 0 to 1800 W m2 5 of full scale UV Index 0 1 Index 0 to 16 5 of full scale Time 1 min 24 hours 8 sec Mon Date 1 day mo...

Страница 55: ...epeater function on and to select a repeater ID Pressing 2ND and WIND sets the console to receive the signal from a repeater instead of directly from a station The first Repeater ID displayed is repea...

Страница 56: ...ic Pressure Trend Arrows show direction of pressure change for last three hours Contacting Davis Technical Support If you have any questions or encounter problems installing or operating your Vantage...

Отзывы: