4. Application and Data
4.1. Main Page
When starting the Danfoss SolarApp after the initial configuration, either through a Smart-
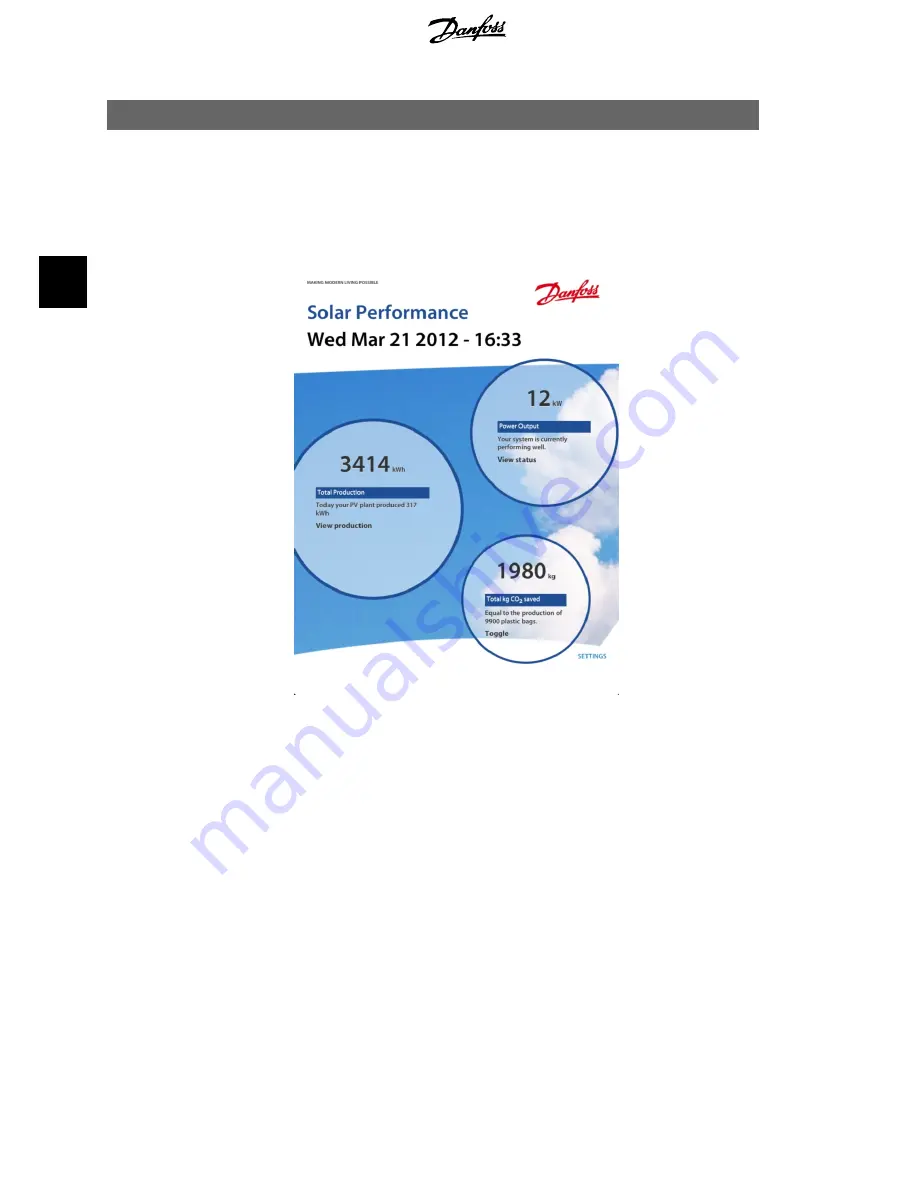
phone, a tablet or using the PC and a browser plugin, the following main page is shown:
Illustration 4.1: Main Page
Allow a few minutes from power-on of the CLX product for correct values to be shown on the
main page (allow time for initial data collection).
The main page displays all the important plant production data including a user-definable plant
name and the current 'date and time' settings. For configuration, see the
Settings
sections.
From the main page navigate to pages with more detailed information by clicking on the indi-
vidual circles and links:
•
Click on 'View production' (large circle to the left) to see graphs with production data,
see the
Production Graphs
section.
•
Click on 'View status' (upper right circle) to see detailed status of the connected inver-
ters and current power output, see the
Plant Status
section.
•
The lower right circle shows how much CO
2
the plant has saved, compared to standard
electricity production. It does not link to a page, but by using 'Toggle' the user can
switch between total CO
2
savings and total revenue.
•
Click on 'Settings' (lower right corner) to navigate to detailed settings, see the
Settings
section.
4. Application and Data
12
L00410618-03_02
4


