xStack DGS-3400 Series Fast Ethernet Switch
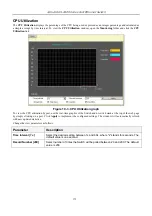
CPU Utilization
The
CPU Utilization
displays the percentage of the CPU being used, expressed as an integer percentage and calculated as
a simple average by time interval. To view the
CPU Utilization
window, open the
Monitoring
folder and click the
CPU
Utilization
link.
Figure 10- 3. CPU Utilization graph
To view the CPU utilization by port, use the real-time graphic of the Switch and/or switch stack at the top of the web page
by simply clicking on a port. Click
Apply
to implement the configured settings. The window will automatically refresh
with new updated statistics.
Change the view parameters as follows:
Parameter
Description
Time Interval
[1s ]
Select the desired setting between 1s and 60s, where "s" stands for seconds. The
default value is one second.
Record Number
[200]
Select number of times the Switch will be polled between 20 and 200. The default
value is 200.
173
Содержание xStack DGS-3427
Страница 42: ...xStack DGS 3400 Series Fast Ethernet Switch Figure 6 1 Device Information and general settings 31...
Страница 138: ...xStack DGS 3400 Series Fast Ethernet Switch Figure 7 48 Access Rule Configuration window Ethernet 127...
Страница 213: ...202...
Страница 224: ...213 D Link D Link D Link D Link 095 744 00 99 http www dlink ru email support dlink ru...
Страница 227: ...216...
Страница 243: ...232 Ver 1 00...
Страница 246: ......

