Chapter 7: Statistics Application
136
u
To configure statistical graph settings
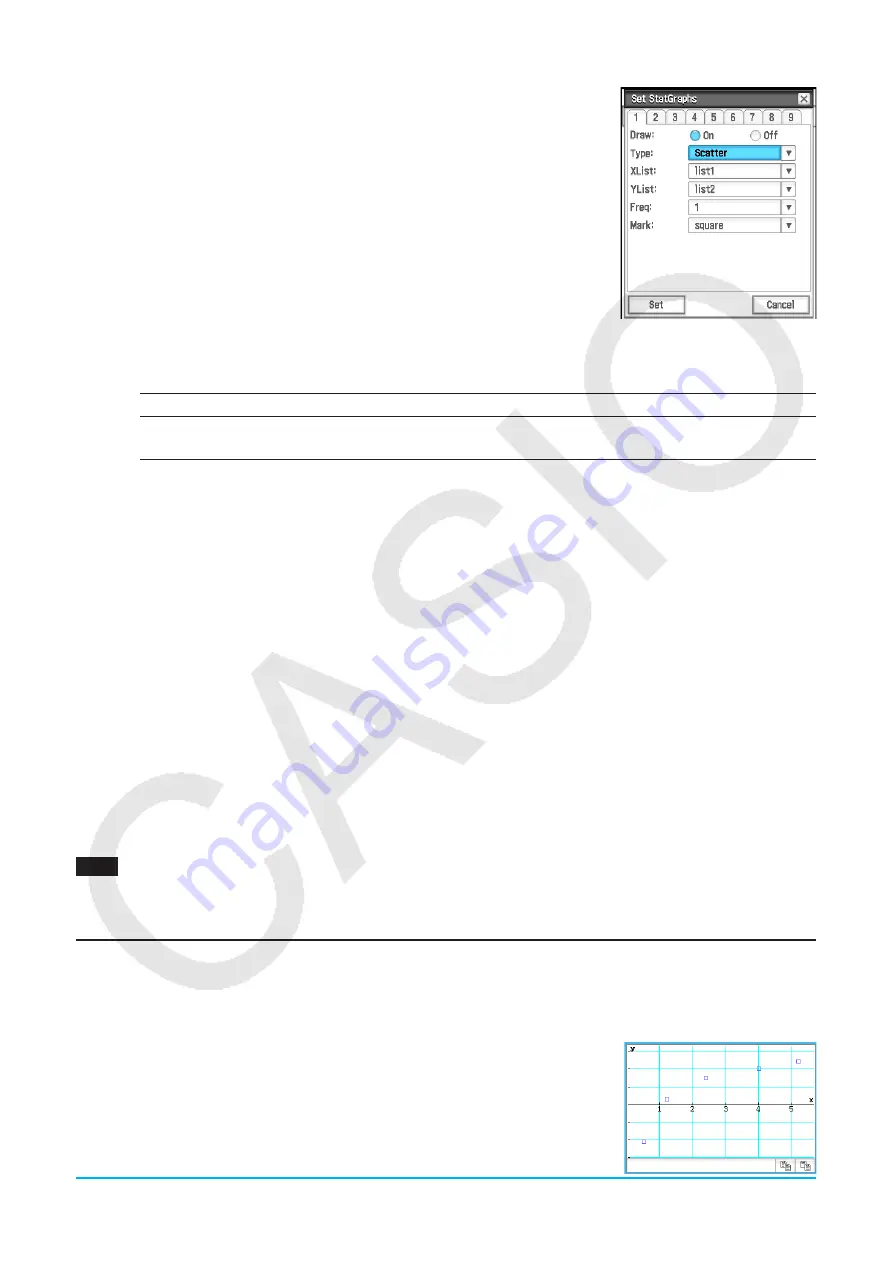
1. On the Stat Editor window, tap [SetGraph] - [Setting…] or tap
G
.
• This displays the Set StatGraphs dialog box. There are tabs named 1
through 9 that correspond to StatGraph1 through StatGraph9.
• Each tab is assigned a color. Tabs [1] and [6]: Blue; Tabs [2] and [7]: Red;
Tabs [3] and [8]: Green; Tabs [4] and [9]: Magenta; Tab [5]: Black
2. Tap the tab for the StatGraph setup whose configuration you want to
change.
3. Configure the StatGraph setup settings you want as described below.
Draw:
Select the On setting if you want to draw the tab’s graph, or Off if you
do not want to draw it. After closing the dialog box, tap
y
on the
toolbar to execute the graph draw operation.
Type:
Selects the type of graph to be drawn. The types of graphs available for selection depend on whether
the graph data is single-variable or paired-variable.
Single-variable
NPPlot, Histogram, MedBox, NDist, Broken
Paired-variable
Scatter,
xy
Line, LinearR, MedMed, QuadR, CubicR, QuartR, LogR,
ExpR, abExpR, PowerR, SinR, LogisticR
For details about each graph type, see “Graphing Single-Variable Statistical Data” (page 136) and
“Graphing Paired-Variable Statistical Data” (page 137).
XList, YList, Freq:
Specifies the list data to be used for graphing. If you prepared frequency list data, use
Freq to specify the frequency list.
Mark:
This setting is supported only when Scatter,
xy
Line, or NPPlot is specified for “Type”. Select square
(
q
), cross (
w
), large dot (
;
) or dot (
'
) as the shape for graph lot points.
4. Tap [Set] to apply the settings for the tab you selected in step 2.
u
To draw a statistical graph
1. On the Stat Editor window, tap [SetGraph], and then confirm that there is at least one item from [StatGraph1]
to [StatGraph9] whose check box is selected.
• If no check box is selected, select at least one check box. Selecting multiple check boxes will cause the
corresponding graphs to be drawn simultaneously.
2. Configure the
a
- [Stat Window Auto] - [On] / [Off] setting as required.
• Selecting [On] for this setting configures View Window settings for drawing statistical graphs automatically.
See “Graph Format Dialog Box” (page 38) for details.
3. Tap
y
to display the Stat Graph window and draw the statistical graphs.
0701
To input the paired-variable data shown below and then plot the data on a scatter plot
list1 = 0.5, 1.2, 2.4, 4.0, 5.2
list2 = −2.1, 0.3, 1.5, 2.0, 2.4
Graphing Single-Variable Statistical Data
You can produce any of the graphs described below using single-variable data. The text in the parentheses of
the graph names below shows text that appears on the Type menu of the Set StatGraphs dialog box.
Normal Probability Plot (NPPlot)
The normal probability plot plots data against a theoretical normal distribution
using a scatter plot. If the scatter plot is close to a straight line, then the data is
approximately normal. A departure from the straight line indicates a departure
from normality.


