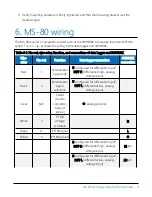
Table 6-1: Pin-out, wire color, function, and connections of data logger and 3WHB10K
Wire
color
Pin-out
Function
Data logger connection
3WHB10K
connection
⏚
(analog ground)
GND pin
U configured for voltage excitation
1
,
EX, VX (voltage excitation)
Black wire
1
U channels are automatically configured by the measurement instruction.
7. Solar radiation programming
The pyranometer outputs a low level voltage that is measured using either the
VoltDiff()
CRBasic instruction or
VoltSE()
CRBasic instruction.
CAUTION:
Nearby AC power lines, electric pumps, or motors can be a source of electrical noise. If the
sensor or data logger is located in an electrically noisy environment, the measurement should
be made with the 60 or 50 Hz rejection integration option as shown in the example programs.
If measurement time is not critical, the autorange option can be used in the
VoltDiff()
or
VoltSE()
instruction; the autorange adds a few milliseconds to the measurement time.
Otherwise, select the input range as follows:
1. Estimate the maximum expected input voltage by multiplying the maximum expected
irradiance (in W × m
–2
) by the calibration factor (in μV / W × m
–2
). Divide the answer by
1000 to give the maximum in millivolt units.
2. Select the smallest input range that is greater than the maximum expected input voltage.
If electromagnetic radiation can be a problem, use an f
N1
of 50 or 60 Hz. Select 60 Hz Noise
Rejection for North America and areas using 60 Hz AC voltage. Select 50 Hz Noise Rejection for
most of the Eastern Hemisphere and areas that operate at 50 Hz. The multiplier converts the
millivolt reading to engineering units.
(p. 10) provides the calculations required for the
various units. The offset will normally be fixed at zero (see
MS-80 Secondary Standard Pyranometer
9


