


CS-GSM/GPRS Digital Transceiver Kits (including the COM110A modem)
36
Make sure any local firewalls allow you to make outgoing connections on
the ports being used. (Some institutions limit you to standard ports) .
Make sure the service provider lets you use non-standard ports over
GPRS (a very few apply default firewalls – although normally only for
calls to the logger).
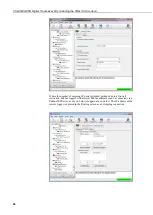
Double check the Net Services settings for the Logger using Device
Configuration program.
If you are using a SIM with a dynamic address check these:
Check the IP address of Loggernet used is correct – it needs to be a
public address (possibly redirected to the LN server by a router if the PC
is on an internal private network).
That the router and PC firewall has holes opened for the logger to call
into. This requires low level configuration of the firewall which might be
Windows own firewall or third party firewall software running on the
machine.
That the server port in Devconfig matches the port specified in
Loggernet.
Check you have an up to date version of Loggernet.
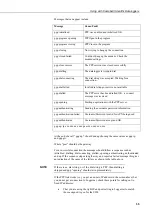
You can also look in Loggernet’s Status/log tool to make sure Loggernet is
listening on the socket for call-backs. When a call-back is made you should see
activity in the log showing a connection is being made.
11.4 GPRS Advanced fault finding
The datalogger has an advanced tracing capability that can be used to debug IP
connection problems at a very low level. The easiest way to capture this
information is to connect a PC to the datalogger via another serial port on the
datalogger, other than the one to which the GPRS modem is connected as
described below. The full trace information can then be captured into a file for
long periods.
If this is not possible it is possible to capture some key trace messages either into a
datatable or file in the datalogger memory. The former is done using the IPTrace
command in your program (see the CRBasic help), however only a limited amount
of information can be captured that way. To capture the trace to a file on the
logger use the File Manager (accessed via the Advanced settings in the Device
configuration utility) and set the ID to 3212. Enter a valid filename and the
maximum file size in the “count” parameter taking into account the free memory
available in the datalogger. The problem with either of these techniques is that
you still have to be able to connect to the datalogger to recover the trace data
unless data can be stored to a card or SC115.
If a second serial connection can be established, follow this process, noting this
assumes the trace capture port will be the RS232 port:
Connect to the logger with the Device configurator program (Devconfig). Open
the settings screen. Go to the bottom and find the IP Trace Code setting. Enter a
value of 65535 in there. On the line above click on the IP Trace Com port and
select RS232 (or the port to be used to capture the trace). Press enter and then
click Apply. This turns on a low level trace output out of the RS232 port.
Now disconnect and in Devconfig go to the bottom of the device list and select
“Unknown”. Select the com port is the one you are using and the baud rate is the
same as you last used the serial port at (usually 115200). (If using the ME port or
another com port for logging the trace, you need to set the baud rate in the port in
Содержание COM110A
Страница 2: ......
Страница 4: ......
Страница 6: ......
Страница 10: ......
Страница 48: ...CS GSM GPRS Digital Transceiver Kits including the COM110A modem 38...
Страница 54: ......
Страница 60: ......
Страница 66: ......
Страница 68: ...CS GSM GPRS Digital Transceiver Kits including the COM110A modem D 2...
Страница 72: ......
Страница 75: ......


