BRONKHORST®
9.17.051
MASS-VIEW®
series
Page 15
3.4
User Interface, menu structure and instrument functions
3.4.1 The readout screen
The readout screen of the
MASS-VIEW
®
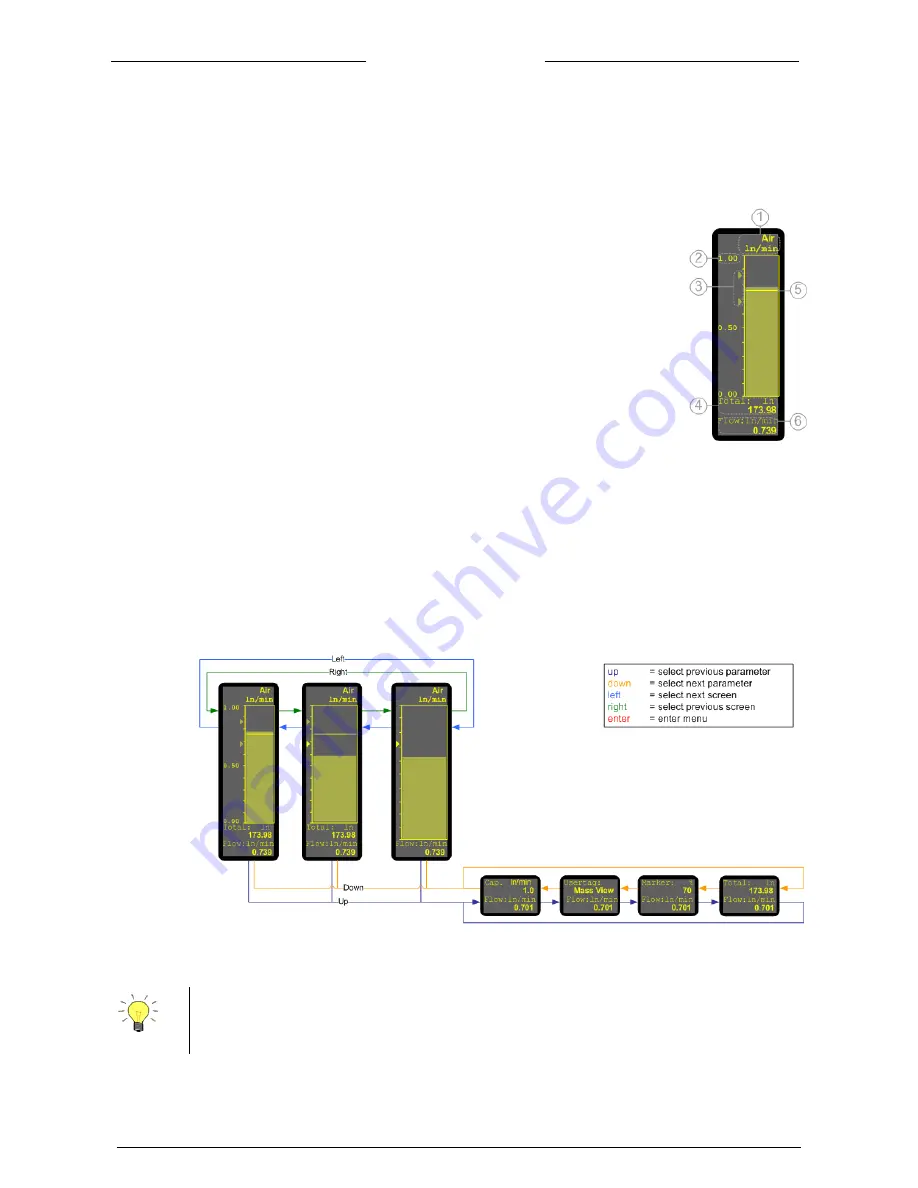
is divided into several blocks as described in the picture
on the right.
1.
At the top of the screen the fluid name and the unit dimensions are
displayed.
2.
Left of the graph the capacity is displayed.
3.
If there are any alarms activated, their values will be displayed at the left
side of the graph.
More information about how to use the alarms can be found in chapter
3.4.6.
4.
The custom readout parameter 1 is displayed near the bottom of the screen.
More information can be found in chapter 3.4.2.
5.
The “Flow marker” indicates the
desired
flow and is only a “marker” where
the actual flow should be. The Flow Marker value can be set in the menu
“marker”.
6.
Readout parameter 2 is displayed at the bottom of the screen and indicates
the actual flow and the selected unit.
3.4.2 Changing the readout screen
It is possible to customize the readout screen using the navigation button (see picture below).
By pressing
left
or
right
one can switch between three different graph sizes. Depending on the selected
graph one can also switch between four different custom readout parameters by pressing
up
or
down
.
1.
Full scale capacity with unit.
2.
Flow marker value. “Off” when flow marker is disabled.
3.
Usertag.
4.
Counter with counter unit. “Off” when counter is disabled.
The readout parameter 2 can be displayed in percentage or actual capacity units. This can be changed
with the “Readout” parameter in the measure menu.
Capacity choice:
Measurement below 2% of the full scale will be interpreted as 0 (m)l
n
/min flow.


