


BVC6100LM Instruction Manual v.01
- 32 -
3)
Aberration sets ”ON” when all input would be completed
2.
Semi Auto setting
1) Aberration, OFF.
2) Click
「
DEFAULT
」
and Input checking position of L-END
、
LEFT
、
RIGHT
、
R-END
values as default. It depends on Lens and WD, see the following table.
3) Capture test chart as follows
Black vertical line must be positioned at L-END
、
LEFT
、
RIGHT
、
R-END.
4) Click
「
ADJUST
」
, auto mode is executed and the result comes out at the Data area.
If there is no black vertical line at default position, it will be Error.
5) It will be saved when Aberration set ”ON”.
6) Click
「
SAVE
」
, setting data would be saved.
For L-END
、
LEFT
、
RIGHT
、
R-END setting
it depends on Lens focal length and WD, see the following table.
Recommendation of collection position
:
2 position are corrected by polyline approximation correction at right side and left side
separatelly. There are 4 setting position such as L-END, LEFT, RIGHT and R-END, it depends
on Lens focal length and WD, see the following table.
Recommendation for collection position
Lens
WD
L-END
LEFT
RIGHT
R-END
BV-L1024
2m
-2043
-1637
1637
2043
BV-L1024
0.5m
-2043
-1433
1433
2043
BV-L1028
0.5m
-2043
-1637
1637
2043
BV-L1028
2m
-2043
-1842
1842
2043
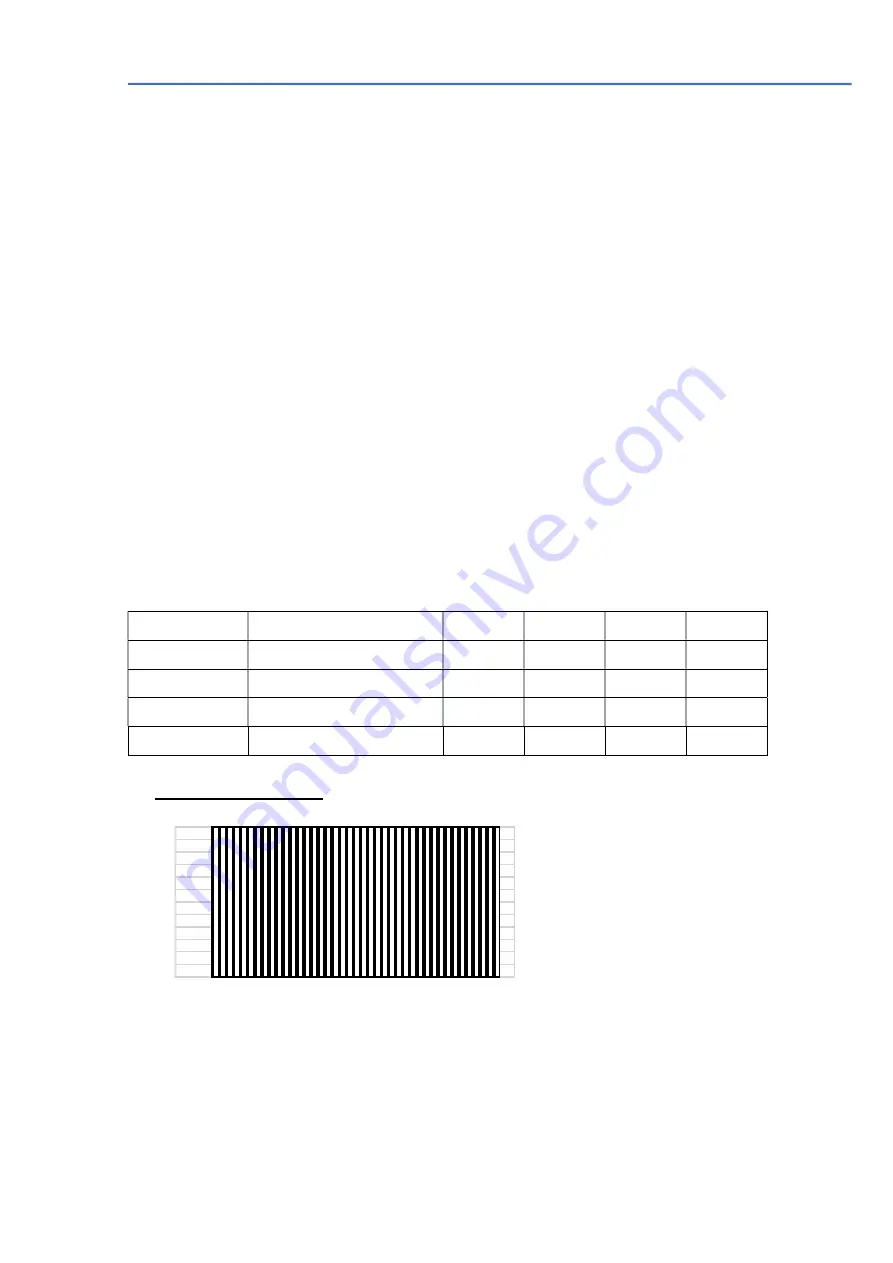
Test chart(example)
Prepare the following chart for adjustment
The above chart is the width of bar is 50 pixels (7μm x 50=0.35mm) and total number
of vertical bar is 82 (black and white)
Shoot this type of chart so that the width is fit in full screen.
▶
◀
▶
◀
▶
◀
▶
◀
▶
◀
▶
◀
▶
◀
▶
◀
▶
◀
▶
◀
▶
◀
▶
◀


