Quick Start Guide - Bluetechnix ToF Visualizer
Last change: 7 May 2015
Version 2
© Bluetechnix 2015
Page | 10
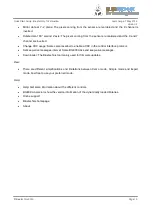
The integration time can be read and written by clicking ‘Get’ and ‘Set’. By increasing the integration
time, the depth range of the sensor can be increased. Dark objects can be seen more clearly. A
higher integration time can also mean that objects get overexposed (they appear white in Distance
and X channel)
The frame-rate can be read and written by clicking ‘Get’ and ‘Set’. Depending on the integration
time, filter configuration or other influences the actual frame rate may not reach the desired value.
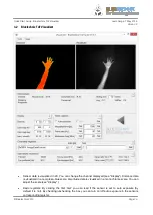
Display: You can choose which channels are being displayed in the above picture boxes. The sensor
sends a data stream consisting of various channels. The default configuration is ‘Distance &
Amplitude’, which means that a channel with radial distance data and a channel with amplitude data
(brightness) is transmitted. The image mode can be changed by using the “Image” menu or by
writing register ‘ImageDataFormat’ (please consult the sensor’s Software User Manual)
You can adjust the colour- or brightness scale for the above picture boxes. Distance and
coordinates are painted in red-green-blue, where ‘Colour map min’ represents the value which is
painted red and ‘Colour map max’ is the data to be painted in blue. Amplitude data is painted in grey
values, where ‘Colour map min’ is painted in black and ‘Colour map max’ is painted in white.
For more detailed help, please click on one of the many question mark buttons or contact Bluetechnix
support.

