


TagTemp USB Temperature Logger
0568 0037-01
0141 0315-92 28.11.2022
B+B Thermo-Technik GmbH | Heinrich-Hertz-Str. 4 | D-78166 Donaueschingen
Seite
7
von
14
Technische Änderungen vorbehalten
Fon +49 771 83160 | Fax +49 771 831650 | [email protected] | bb-sensors.com
F
IGURE
7
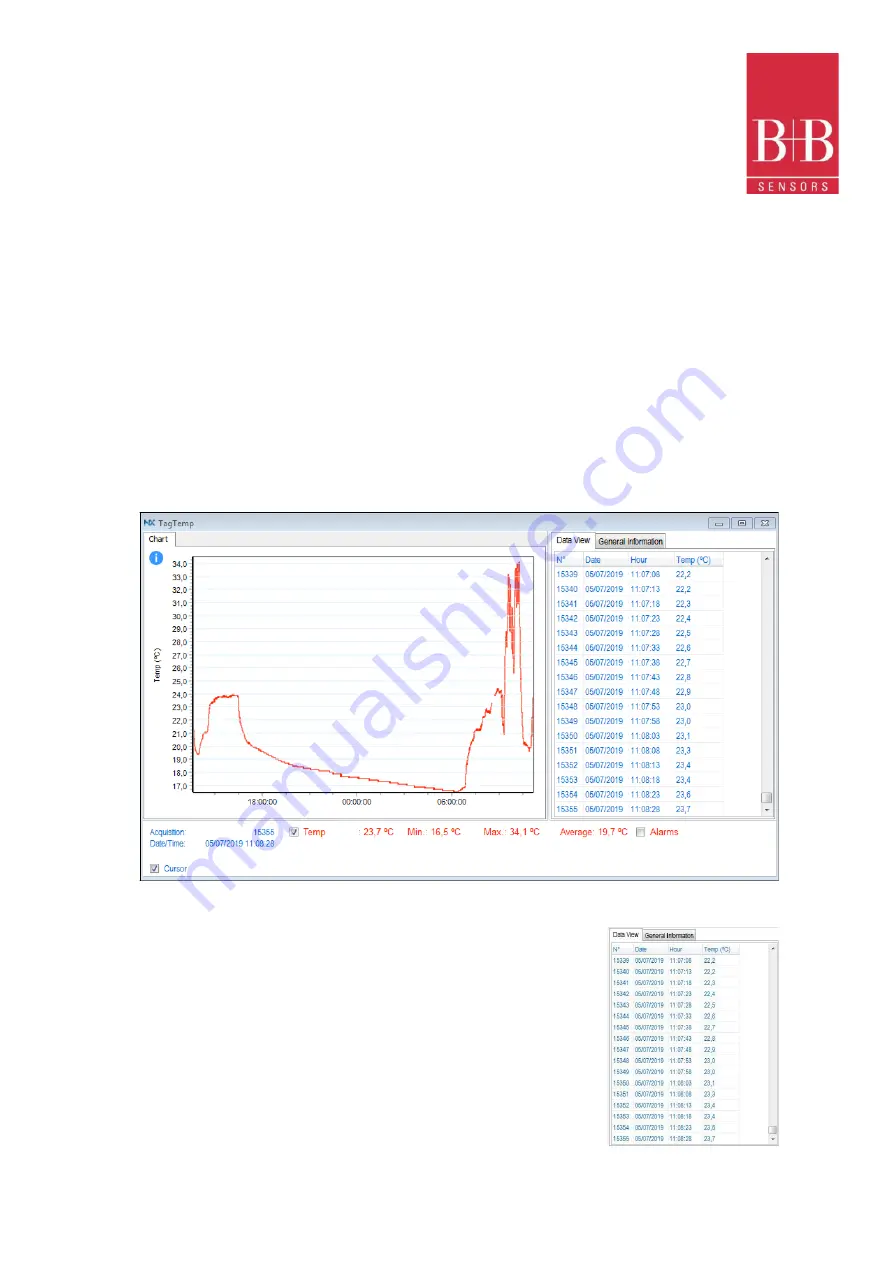
NXperience Chart Window
F
IGURE
9
Data View Table
7.3
Downloding and Data Visualisation
Data downloaded are send from device to PC. Data can be downloaded any time: at the end of the logging process or while they are being
acquired.
If data download takes place during the logging process,
the process will not be interrupted
, following the device configuration
7.3.1
Downloading Data
Data download is accomplished by clicking the button
Download Logs
in the
Download
screen from
NXperience
.
During data transference, a status bar indicates remaining data to be transferred. Data downloading time is proportional to the number of readings logged
7.3.2
Visualizing Data
At the end of values transfer, the data will be displayed in a graphical form
7.3.2.1
Chart Window
It is possible to select a region of the chart to zoom in. Zoom commands can be accessed through zoom icons from the task bar.
It is also possible to select an area from the chart to zoom in by clicking and dragging the mouse, thus creating a zoom region starting from the upper left corner
on the chart area.
The graphic curves can be vertically dragged with a right-click and dragging the mouse up and down
7.3.2.2
Data View Table
Values are presented in a tabular form, listing the measurement time and value.
F
8
C
ti f Pt100 S


