


w
w
w
.four
tec
.c
om
INNOVATIVE
MONITORING
SOLUTIONS
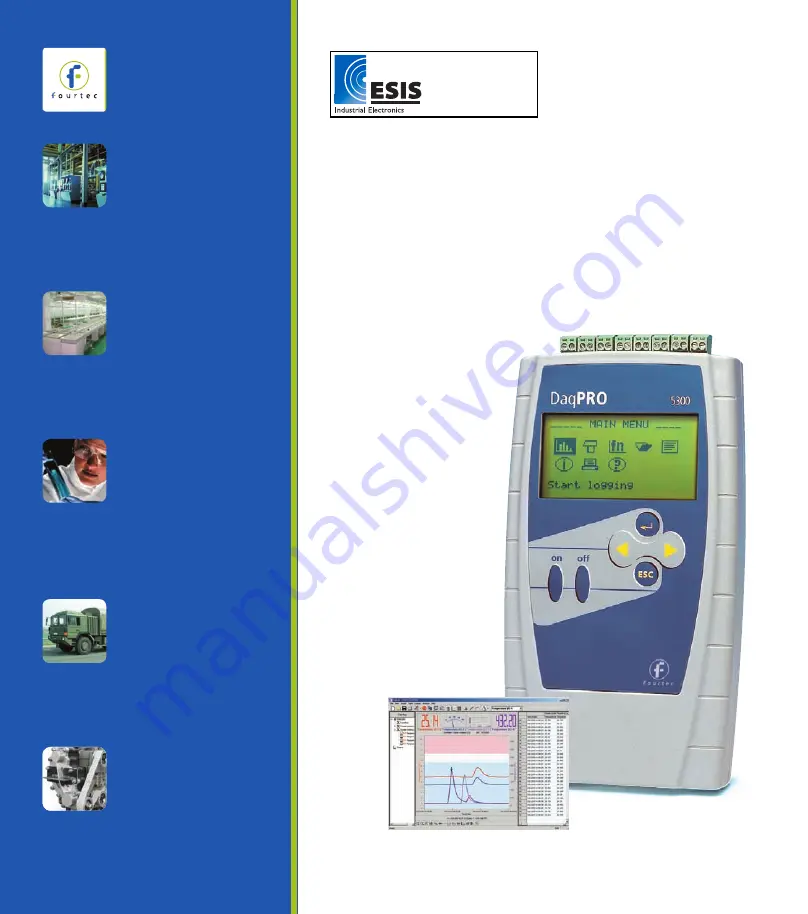
DaqPR
O
Solution
ALL
IN
ONE
SOL
UTION
FOR
D
AT
A
LOGGING
AND
ANAL
YSIS
RESEARCH &
DEVELOPMENT
Academic and industrial
laboratory research
measuring multiple
parameters
TESTING
STANDARDS
Ensuring quality control
and compliance with
safety standards
FAC TORIES
Monitoring product
quality throughout the
entire manufacturing
cycle
MILITARY
Storage, equipment
maintenance,
machinery and
production testing
AUTOMOTIVE
Compatibility tests,
electronics, control
panels and engine
operating temperatures
User Guide
including DaqLab
www.esis.com.au
Ph 02 9481 7420
Fax 02 9481 7267


