UG-1870
Evaluation Board User Guide
Rev. 0 | Page 12 of 15
25052-
015
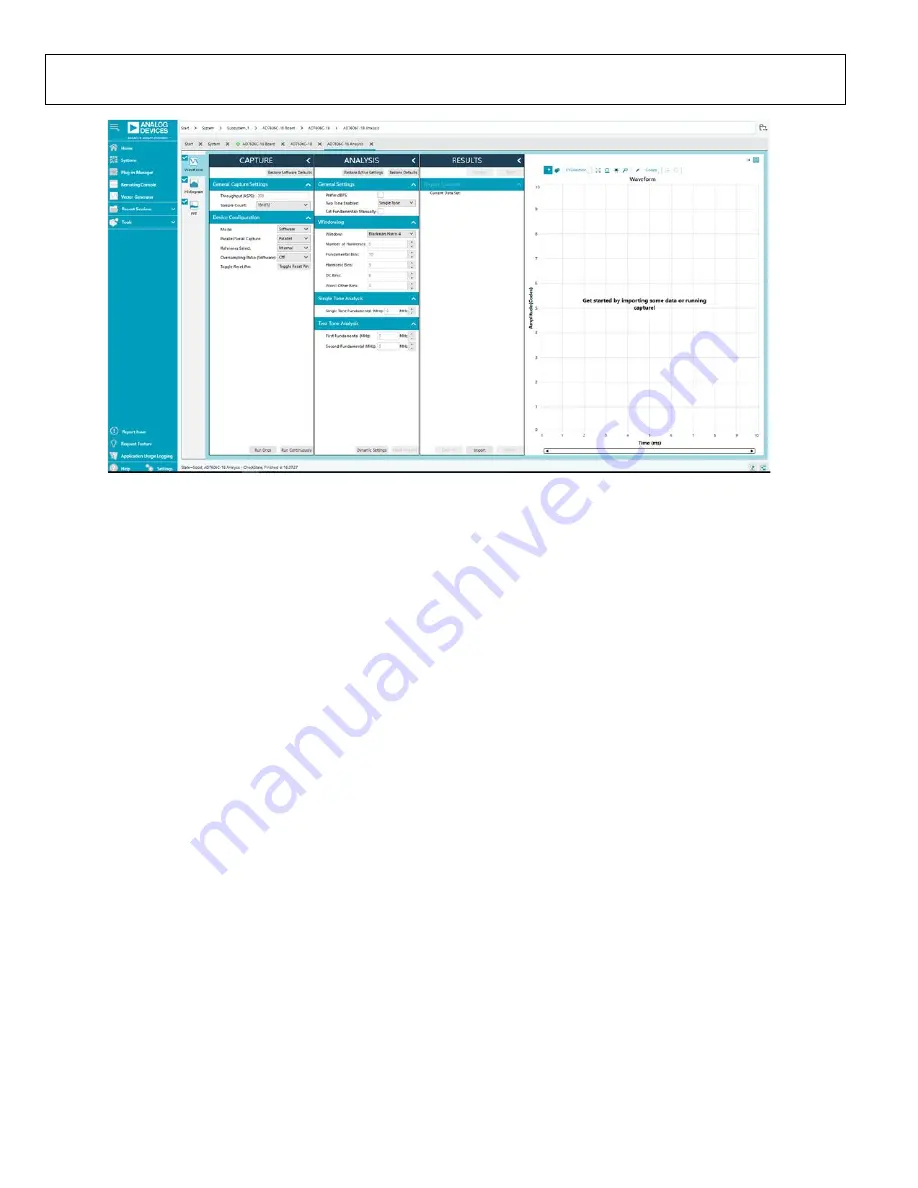
Figure 15.
AD7606C-18 Analysis
View Window
DESCRIPTION OF ANALYSIS WINDOW
Click
Proceed to Analysis
in the
AD7606C-18
chip view
window (see Figure 12) to open the
AD7606C-18 Analysis
view window shown in Figure 15. The analysis view window
contains the
Waveform
tab,
Histogram
tab, and
FFT
tab.
WAVEFORM TAB
The
Waveform
tab displays data in the form of time vs. discrete
data values with the results, as shown in Figure 16.
CAPTURE Pane
The
CAPTURE
pane contains the capture settings, which
reflect onto the registers automatically before data capture.
The
Sample Count
pulldown menu in the
General Capture
Settings
section allows the user to select the number of samples
per channel per capture (see Figure 16).
The user can enter the input sample frequency in kSPS in the
Throughput (kSPS)
box in the
General Capture Settings
section (see Figure 16). Refer to the
determine the maximum sampling frequency for the selected
oversampling ratio and data interface mode.
The
Mode
pulldown menu in the
Device Configuration
section can be set as either
Hardware
, meaning that the device
is configured through digital input pins, or
Software
, which
allows reading and writing of the memory map and enables a
wider range of features (see Figure 16). Refer to the AD7606C-
18 data sheet to determine the benefits of hardware and
software mode.
The
Parallel/Serial Capture
pulldown menu in the
Device
Configuration
section allows the user to select the data
interface as either
Parallel
or
Serial
(see Figure 16). If
Serial
is
selected, the number of data lines can be selected through the
DOUT Configuration
pulldown menu.
The
Oversampling Ratio (Software)
pulldown menu in the
Device Configuration
section can be set between 2 and 64 (in
hardware mode) or 256 (in software mode) and provides improved
signal-to-noise ratio (SNR) performance (see Figure 16). Refer
to the AD7606C-18 data sheet to determine the maximum
oversampling ratio for the selected oversampling mode.
When hardware mode is enabled, the
Input Range
pulldown
menu allows the user to select an input span between ±10 V
and ±5 V. In software mode, the input span is selected either in
the
AD7606C-18 Memory Map
or a configurable pop-up
window in the
AD7606C-18
chip view window, as shown in
Figure 13.
The
Toggle Reset Pin
button in the
Device Configuration
section issues a full reset to the AD7606C-18 (see Figure 16).
Refer to the AD7606C-18 data sheet for the different reset
options available on the AD7606C-18.
Click
Run Once
to start a data capture of the samples at the
sample rate specified in the
Throughput (kSPS)
pulldown
menu for the number of samples specified in the
Sample Count
pulldown menu (see Figure 16). These samples are stored on
the FPGA device and are only transferred to the PC when the
sample frame is complete.
Click
Run Continuously
to start a data capture that gathers
samples continuously with one batch of data at a time
(see Figure 16). This operation runs the
Run Once
operation
continuously.
RESULTS Pane
The
Display Channels
section allows the user to select the
channels to capture (see Figure 16). The channel data is shown
only if that channel is selected before the capture.


