


19
©2003-2021 Anago Ltd
Raw
Test Data shows the data as it was recorded by the KST. It shows the actual forces
measured by the Anago KST.
Clean
Test Data presents the analysed forces after normalization, i.e. a peak analysis of the
data with the initial flat (prior to the blade hitting the media) removed.
Each of these can be found on the corresponding tabs: “Raw”, “Clean” and “Score” in the “View Tests”
option.
Note:
A set of results needs to be selected and ticked for this function to work.
Click the relevant table to display different graph types.
It is possible to zoom in on results for closer inspection: Drag / draw a box on the graph to
zoom in on those results. To return to full view, double-click on the chart.
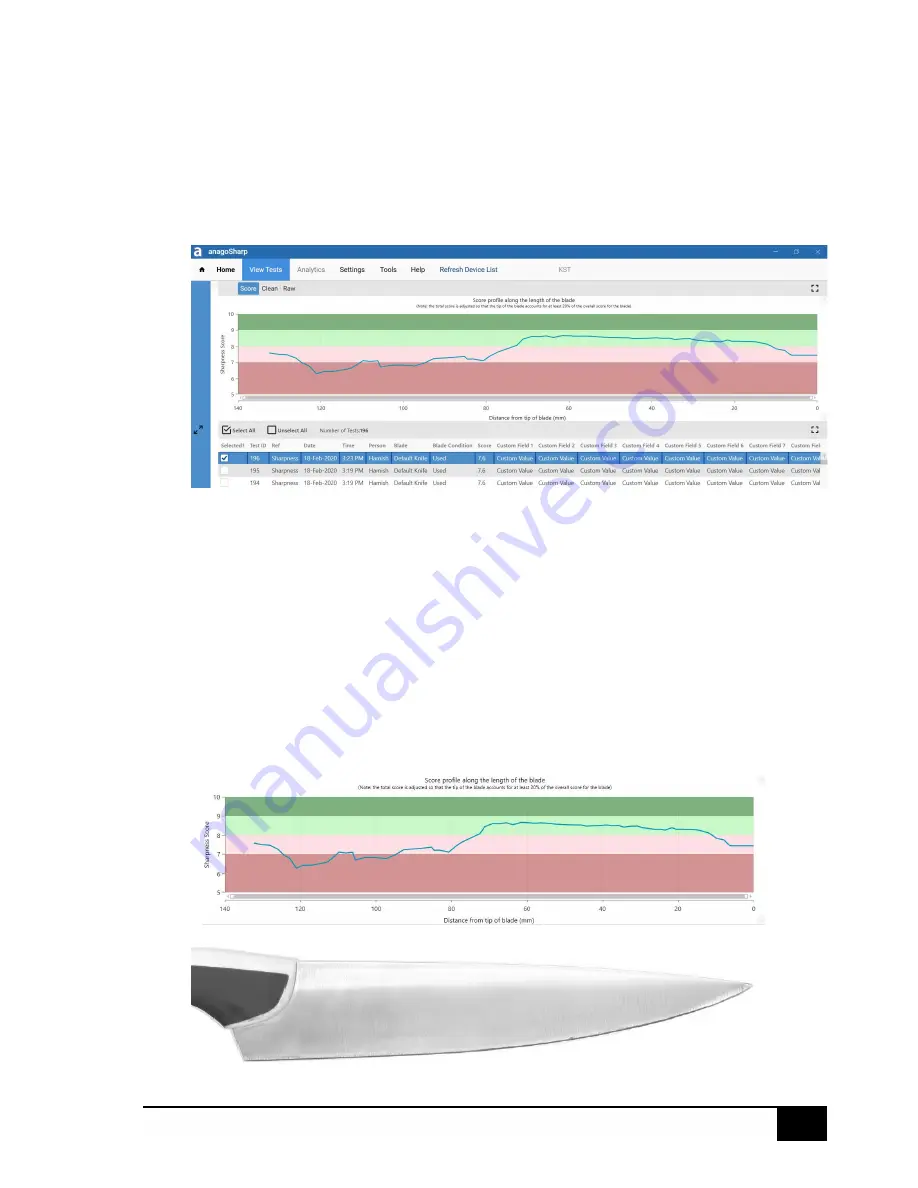
Score
This is the most common way of viewing the results of a sharpness test.
This mode shows you an overall sharpness score out of 10 for your blade and produces a profile of
sharpness. Each section of the blade is categorized under sharpness zones on the vertical axis.
This view is also useful when layering tests on top of each other for a direct comparison of
sharpness, or to track an individual blade’s performance over time.
Содержание KST Series
Страница 30: ...29 2003 2021 Anago Ltd ...


