background image


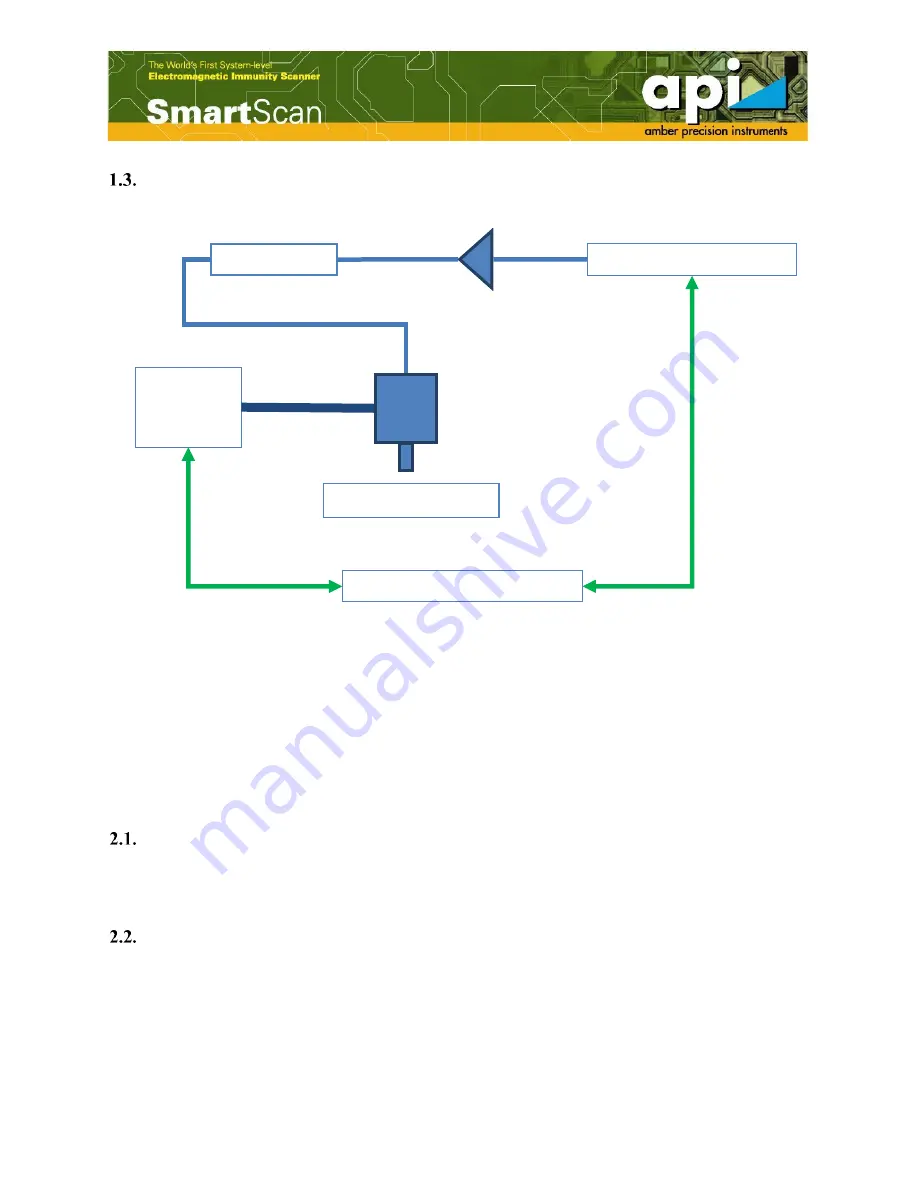
Diagram of RFI measurement wiring 


Figure 2: Measurement setup diagram of RFI scanning. 


2.


RFI Scanning Operation Procedures 

It  is  required  user  to  read  “API  SmartScan  V5.0  Operation  Manual  (Common  Part)”  before 
starting the RFI measurement. For detailed operation procedures,  also refer to  “API SmartScan 
V5.0 Operation Manual (Common Part)”. 


Setup test environment 

The hardware set up should be done first, e.g. the probe is attached to the robot; amp, attenuator, 
cables and instrument are connected. 


Create a project 

Go to  SmartScan software, create  a “Workspace”, name the workspace,  create an RFI project, 
and name the project. 

DUT


Attenuator


Signal Generator


SmartScan software


Power


Amp


(50 dB)


(3-10 dB)


Robot


Positioning


System


RFI probe


Содержание api SmartScan V5.0

Страница 1: ...1 Radio Frequency Immunity Measurement Setup V 5 0 Amber Precision Instruments Inc Dec 2017 ...

Страница 2: ...t 13 List of Figures Figure 1 Block diagram of RFI scanning 3 Figure 2 Measurement setup diagram of RFI scanning 5 Figure 3 Create a new workspace 6 Figure 4 Name the workspace and save in a directory 6 Figure 5 Create a new RFI project 7 Figure 6 Name the RFI project 7 Figure 7 Capture DUT image 8 Figure 8 Probe Z offset icon 8 Figure 9 Probe Z offset calibration window 9 Figure 10 Reference poin...

Страница 3: ...f the coupling An RF signal or a modulated RF signal is fed into a probe The probe is moving around the product while the product is observed for signs of disturbances The strength of the disturbance is automatically recorded for each location A map of the local sensitivity of the product is created helping to understand the reason for the immunity problem RFI scan is very similar to ESD scan but ...

Страница 4: ...esolution USB camera is attached to the robot and used to take pictures of the DUT The sensitivity of the DUT to the disturbance is color coded and then superimposed on the picture taken by the USB camera prior to the test Power Amplifier A 50 dB gain power amplifier PA is used to increase the signal strength Attenuator An attenuator is placed between RFI probe and power amplifier for better imped...

Страница 5: ...procedures also refer to API SmartScan V5 0 Operation Manual Common Part Setup test environment The hardware set up should be done first e g the probe is attached to the robot amp attenuator cables and instrument are connected Create a project Go to SmartScan software create a Workspace name the workspace create an RFI project and name the project DUT Attenuator Signal Generator SmartScan software...

Страница 6: ...6 Figure 3 Create a new workspace Figure 4 Name the workspace and save in a directory ...

Страница 7: ...7 Figure 5 Create a new RFI project Figure 6 Name the RFI project ...

Страница 8: ...e the camera is on top of DUT then click on Take Picture to capture a DUT image Figure 7 Capture DUT image Define probe Z offset Click on Calibrate Probe Z offset icon to define probe Z offset Follow the instruction in Probe Tip Offset Calibration to complete Z offset calibration Figure 8 Probe Z offset icon ...

Страница 9: ...erence point in the DUT image location of reference point can be random but better to choose a point where probe can be easily aligned Measure the DUT height reference point height User can choose either the touch sensor method to detect height automatically or choose the manual way to get the DUT height Figure 10 Reference point ...

Страница 10: ...10 Figure 11 Detect DUT height by touch sensor Figure 12 Get DUT height manually Calibrate probe XY offset Figure 13 Calibrate probe XY offset ...

Страница 11: ... V5 0 Operation Manual Common Part for detailed information Check instrument and SmartScan software connection Build connection between SmartScan and instrument Select the corresponding signal generator model communication port and click on Test Connection to verify the connection Figure 15 Open Options window ...

Страница 12: ...setting window Open Instrument Settings window and set parameters Go to Instrument Settings User can choose the sweep mode modulation mode frequency range power value etc according to measurement requirements Figure 17 Instrument settings window ...

Страница 13: ...13 Run measurement Click the Run button to run scanning Figure 18 Run measurement ...

Отзывы: