8.1 Noise floor
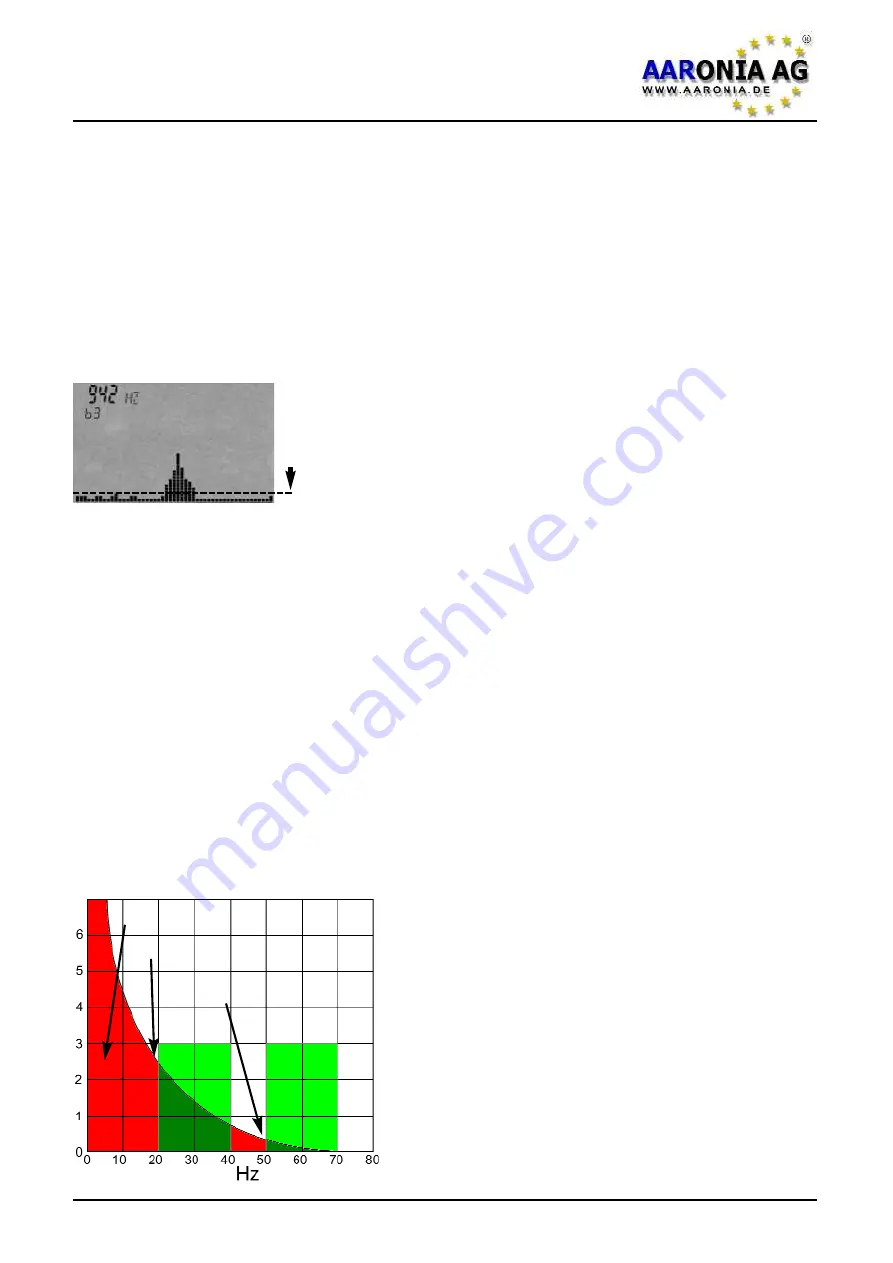
The so-called noise floor indicates the lower range limit below measurements
become physically impossible. Only interference can be found below this limit.
Visually, this will be shown as a collection of little “dots“ or bars in SPECTRAN’s
display which either stay at fixed places or change with every sweep (noise).
Depending on the actual frequency, however, the noise floor can very vary
.
Usually the noise floor will increase significantly in lower frequency levels. For
example, the noise floor at 50Hz (mains power) is significantly stronger than at
500Hz. This is often called the “0Hz spike“:
8.2 The 0Hz spike and the noise floor
When using a spectrum analyzer, the closer you get to a “frequency“ of 0Hz (the
so-called 0Hz spike), the stronger the
natural noise floor
becomes and the
worse the measurement accuracy will be. Measurements quickly hit physical
limits in this range. To achieve still the best possible sensitivity, at least the
resi-
dual noise
of the amplifiers, i.e. the measurement electronics themselves, has
to be kept to a minimum by using only high-grade,
extremely low-noise ampli-
fiers
like in SPECTRAN, which actually goes quite close to the actual physical
limits.
When doing measurements close to 0Hz, pay attention to the following recom-
mendations:
The closer you get to the 0Hz spike, the stronger the “received“ noise and
the less accurate the measurement:
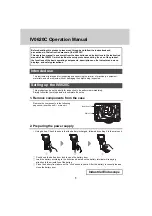
The simulated graph shows the 0Hz spike as a
steep curve starting at 0Hz (left side) which
quickly flattens towards higher frequencies.
Also visible: the simulated sweep from 20-
40Hz results in a much higher value of back-
ground noise (about 2,5) than another from 50-
70Hz (0,2) even though the SPAN of both
sweeps is identical.
8.0 Correct measurement
Firmware V 1.0 / © 2005-2013 by Aaronia AG, D-54597 Euscheid, www.aaronia.com
33
Noise floor
(below this imaginary line)
High
noise
0Hz noise floor
Low
noise
20-40Hz
50-70Hz


