User Guide
including
Multi
Lab
™
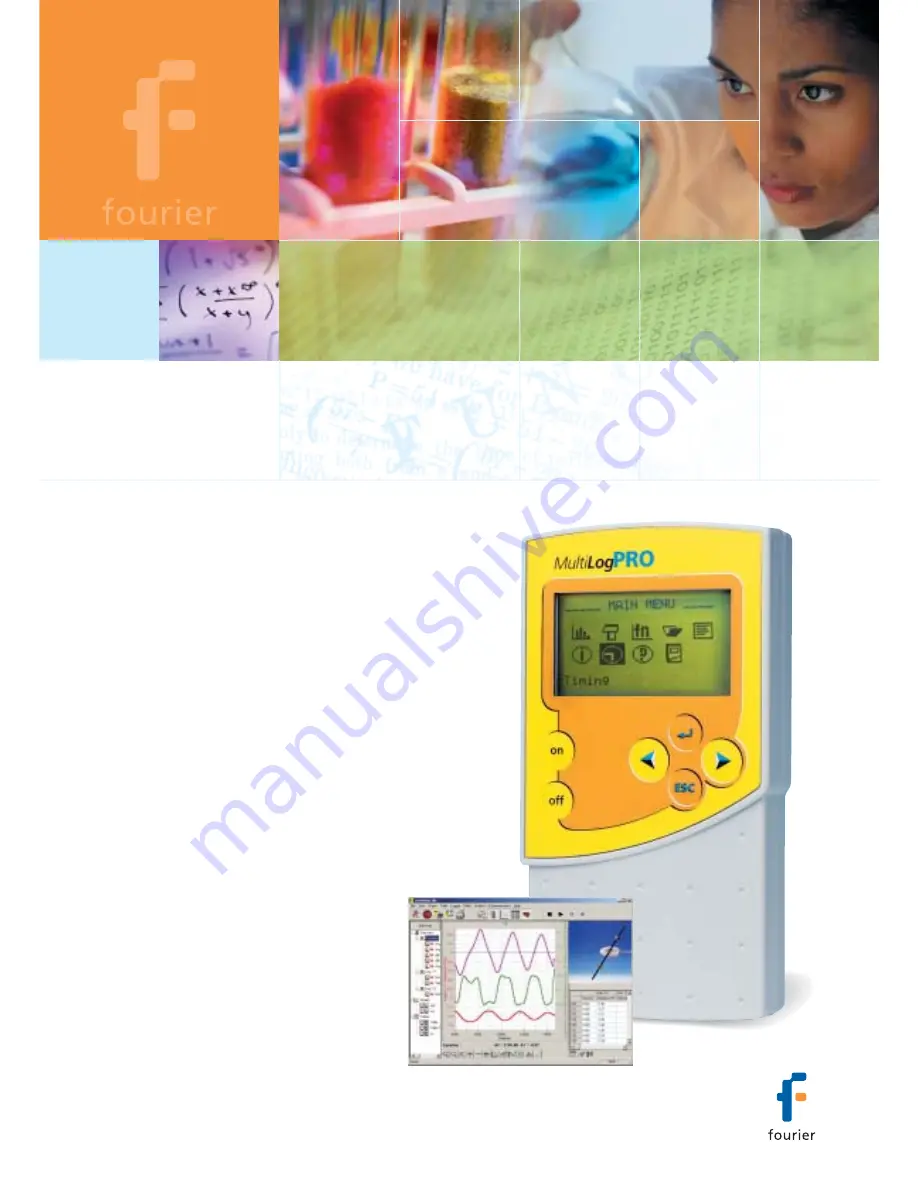
Multi
Log
PRO
™
Put the world of scientific data at the fingertips of your students
The perfect combination between
a graphic calculator and a data
logger
New & Improved!
12b resolution & timing module
New & Improved!
12b resolution & timing module
Integrating student
computing & science
Summary of Contents for MultiLab
Page 2: ...MultiLogPRO User Guide Fourier Systems Eleventh Edition First Print Printed in July 2006...
Page 3: ......
Page 9: ......
Page 117: ...108 Chapter 2 MultiLab Software...
Page 133: ...124 Chapter 3 Working with a TI Calculator...
Page 137: ...128 Chapter 5 Specifications...
Page 145: ...136 Chapter 5 Specifications...