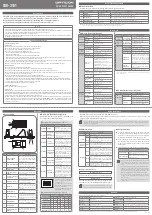
background image


ESD Scanner Operation Manual 

V 5.0 

Amber Precision Instruments, Inc.


Nov 2016 

Summary of Contents for SmartScan 350

Page 1: ...1 ESD Scanner Operation Manual V 5 0 Amber Precision Instruments Inc Nov 2016 ...

Page 2: ... 23 4 6 Create a New Failure Detection FD Project 27 4 6 1 Create an FD Project 27 4 6 2 Set up Analog and Digital Channels 31 4 6 3 Timing Setting 36 4 6 4 Start Monitoring 37 4 6 5 Threshold 37 4 7 Set Macros 40 4 8 Instrument Settings 42 4 9 Start ESD Scan 45 5 Reviewing measurement data 47 5 1 3D Plot Options 48 5 1 1 Selecting a Plot Type 48 5 1 2 Show Plot as 3D 49 5 1 3 3D Browser 50 5 1 4 ...

Page 3: ...t window 16 Figure 13 DUT picture in scan area 16 Figure 14 Zoomed in DUT picture 17 Figure 15 Click left mouse button to define polygon scan area 18 Figure 16 Polygon scan area as defined 18 Figure 17 Cut out polygon area 19 Figure 18 Scan Area Properties pane 19 Figure 19 Multiple scan area definition 20 Figure 20 Detect selected area height by touch sensor 20 Figure 21 Make sure touch sensor is...

Page 4: ...channel 32 Figure 51 Analog Channel Setup window 33 Figure 52 Analog Channel Setup window 33 Figure 53 Analog channel is added to the group 34 Figure 54 Add digital channel 34 Figure 55 Select the device port 34 Figure 56 Digital channel is added to the group 35 Figure 57 Digital channel setup window 36 Figure 58 Go to Timing Settings 36 Figure 59 Timing Settings window 36 Figure 60 Monitoring win...

Page 5: ...ots 54 Figure 95 Data visualization options 55 Figure 96 3D plot range 56 Figure 97 3D plot range example of Current left Absolute middle and Custom right 56 Figure 98 Cut planes option 57 Figure 99 XOY cut plane option 57 Figure 100 XOZ cut plane option 57 Figure 101 YOZ cut plane option 58 Figure 102 Select components 58 Figure 103 Merge data 59 Figure 104 Merge data window 59 Figure 105 Merged ...

Page 6: ...ure 124 Define picture position 66 Figure 125 Define first reference point 67 Figure 126 Move robot to first reference point 67 Figure 127 Record first reference point position 67 Figure 128 Define second reference point 68 Figure 129 Record second reference point position 68 Figure 130 Picture position definition completed 69 ...

Page 7: ...ilure zones of a DUT device under test It consists of a robotic arm scanning surface SmartScan software package TLP transmission line pulsar and FD failure detection module The ESD scanner injects a disturbance into the DUT analyzes the response and displays the data acquired from the DUT in visual form superimposed on the DUT itself Probe movement and data display are fully automated with proprie...

Page 8: ...specified probing positions by one four axis scara robot The robot facilities 4 degrees of movement along x axis y axis z axis and 360 rotation both clockwise and counterclockwise directions Probe The probes function by inducing an ESD disturbance pulse in the established DUT Four different probe types are available to inject magnetic H or electric E fields in directions of x y and z movement The ...

Page 9: ...mode after failure TLP The TLP box produces a very fast pulse that emulates the fields produced by an ESD event 3 Understanding the Terminology TERM DESCRIPTION SmartScan A software package that allows user to set scanning area parameters create a test scenario identify the location and number of test points control data collection facilitates interpretation and visualization and provides a built ...

Page 10: ...rocedures The hardware set up should be accomplished at this point e g the probe is attached to the robot amps cables and instrument are connected Operation procedures are described in the order of normal operation sequence 4 1 Create Workspace and Project As user opens SmartScan V5 0 following window with Workspace Explorer docking pane on left and Wizard pane on right pops up Docking panes can b...

Page 11: ...ne by selecting File on the top left menu bar and select Newworkspace Figure 3 Workspace definition window Create Project Double click Create project from Wizard pane Give Project name and select proper scan technology An ESD scan Project named ESD 1 has been created as shown in Figure 4 Any previously generated Project can be copied to a new Project This feature is useful when scan conditions hav...

Page 12: ... every item on Wizard pane is checked the scan cannot be performed as the redcross mark shows at Run scanning Figure 5 SmartScan window after a Project ESD 1 has been created 4 2 Calibrate Probe Z Offset Most probes from API have same length however slight length variation may occur due to the probe assembly or probe mounting Since it is important to know the actual scan distance height between th...

Page 13: ... of probe Z offset is shown in Figure 6 Figure 6 Probe Z offset example a Double click on Probe Settings under project name on left pane and select Z wizard after the Probe Settings window pops up Figure 7 Open Probe Settings window Figure 8 Probe Tip Offset Calibration window for probe Z offset ...

Page 14: ...be barely touching the table surface c After the robot goes to the home position check if the probe is barely touching the scan table If the height needs to be adjusted click on Robot Movement and move the probe up or down to make it barely touching the scan table surface Figure 9 Robot Movement window d When adjustment is done click on Close to close the robot movement window then click on Finish...

Page 15: ...Area Settings under project name A board image with two semi circles will appear The area between the two semi circles is the area robot can reach The DUT or the desired scan areas must fit inside the area limited by the two semi circles b Click on Snapshot icon in the top menu bar or double click on Take snapshot on Wizard pane Figure 11 Snapshot icon and Take snapshot shortcut c Move the robot t...

Page 16: ...ng the camera to the desired location click on Take Picture then click on OK Once the image of the DUT has been taken the software will automatically super impose the image onto a simulation of the scan table Figure 13 DUT picture in scan area ...

Page 17: ...It allows users to define any shape of scan area Line defines a straight line Point defines a single point The polygon area option will be used as an example in the following procedures Define Scan Area a Zoom in the picture taken in the previous procedure by clicking on the Zoom to Picture button in the top icon bar highlighted in Figure 13 Figure 14 Zoomed in DUT picture b Click on the Polygon A...

Page 18: ...e polygon scan area c Click right mouse button when last point the 7th point in this case is defined to quit the polygon mode The polygon is filled by scan points that are spaced by 1 mm x 1 mm Figure 16 Polygon scan area as defined 1 2 3 4 5 6 7 ...

Page 19: ...area e Click inside of the defined polygon area Scan Area Properties pane will be activated and will be shown on the right window Figure 18 Scan Area Properties pane Height of the DUT Scan steps in X and Y direction Distance scan height The distance between probe tip and DUT surface Retract How far the probe moves up when it moves from one point to next measurement point This is important to preve...

Page 20: ...nd 2 by manually moving the robot A By using the touch sensor a Select a scan area polygon area is selected in this example Please note that the yellow dot inside the scan area indicates the location where the probe will land User can move this yellow point to a different location by click left mouse button and drag the point b Click on Detect Height by touch sensor icon from the top icon bar Figu...

Page 21: ...e if the touch sensor light has been turned on Figure 21 Make sure touch sensor is working d Click on Start The robot will move to the yellow dot inside the scan area and measure the height Figure 22 Start the height measurement using touch sensor e Click on OK when robot stops moving The measured height data will be shown in the Scan Area Properties pane Figure 23 Scan height shown in the Scan Ar...

Page 22: ...to a different location by click left mouse button and drag the point b Click on Get Area Height from Robot icon from the top icon bar The robot movement window will pop up Figure 24 Get area height by moving robot Figure 25 Robot movement window pops up c Move the probe to a point inside the polygon scan area over the DUT Lower the probe down until the probe tip barely touches the DUT Figure 26 P...

Page 23: ...ane e User can type in the height number to other scan area heights if these scan areas are at the same height 4 5 Calibrate Probe XY Offset Although the whole system has been calibrated carefully it is still possible to have misalignment between the probe axis and the robot shaft s axis which will show mismatch between the assigned scan points and real probe landing positions The XY offset is the...

Page 24: ...ign X and Y easily Figure 30 Define reference point b Click on the reference point and define its height The height definition procedures are the same as defining the scan area height If the height of the reference point is the same as the height of the scan area defined in the previous procedure user can type in the same height number for the reference point Distance was given 1mm but usually it ...

Page 25: ...izard Probe Tip Offset Calibration window pops up Follow the instructions shown in Figure 32 Figure 32 Probe XY offset calibration d Click on Next to move the probe to the reference point A message window will pop up warning user robot movement is expected Click on Yes Figure 33 Robot movement warning window ...

Page 26: ... Probe adjustment position aligned with reference point f Close the Robot Movement window after the probe is moved to the reference point g Click on Next h Depends on the probe type click on Next to continue calibration if it is an Hx or Ex probe click on Finish if it is an Hz or Ez probe i Apply the changes Figure 36 Apply XY offset changes X Y X Y ...

Page 27: ... offset changes A joy stick is provided for users convenience Users can monitor probe position while joy stick controls the robot movement 4 6 Create a New Failure Detection FD Project 4 6 1 Create an FD Project a Select FD Projects under Project from the top menu toolbar This operation opens FD Projects window Figure 38 Open FD Project ...

Page 28: ...28 Figure 39 FD Project window b Click on New FD Project icon assign a name for the project and click on OK The new FD project will be shown in the project window Figure 40 Define the name of FD project ...

Page 29: ...en in FD Module icon or delete a project by selecting Delete FD Project icon Once click on the icon the FD project will be opened in the FD Module window Now users will be able to assign Groups and channels By default a first group is automatically created and is given Group 1 name as shown in Figure 42 ...

Page 30: ...ew Groups delete existed groups and rename groups To add a new group go to Project Channel Groups and click on Add New Group The Add Channel Group pops up Give a name of the group and click on OK Figure 43 Add new group Group tag Failure Not failure indication LED FD project name ...

Page 31: ... and click on Delete Audio A warning window pops up Click on OK to continue deleting the group Figure 45 Delete the group Figure 46 Delete group confirmation 4 6 2 Set up Analog and Digital Channels Channels are normally connected via cables that allow communication between the DUT and the Failure Detection Module Graphical representation of analog and digital channel command buttons is shown in F...

Page 32: ...s defined by the physically available analog channels ports built in the FD Module Box as shown in Figure 49 Analog 1 4 is four analog ports that can be connected to four analog inputs Analog 5 is optical input Analog 6 is microphone input and Analog 7 is audio input Figure 48 Analog and digital channels in FD Module s front panel Figure 49 FD Module s front panel Set up Analog Channel a Go to Pro...

Page 33: ...ow c Usually the tested signal exists in a certain voltage range User can set the measurement range the minimum and maximum voltage Figure 52 Analog Channel Setup window d Select the corresponding address for the analog channel Thus one analog channel with the address of Dev12 ai5 is added to the group In a similar manner more analog channels can be assigned to the same group Maximum seven analog ...

Page 34: ...igure 53 Analog channel is added to the group Set up Digital Channel a Go to Project and click on Add Digital Channel Figure 54 Add digital channel b Select the device port Figure 55 Select the device port ...

Page 35: ...e of analog channels those operators AND OR can be changed by a double click directly on the operator that has to be changed A complex failure condition of two elements connected by the AND operator indicates a failure if both of two elements detected a failure On the other hand the OR operator indicates a failure if either of two elements detected a failure Slightly different approach was employe...

Page 36: ...e are two types of digital channel inputs High and Low which defines failure detection condition 4 6 3 Timing Setting The particular Data Acquisition Unit DAQ integrated to the hardware can acquire up to 250000 samples s thus the user needs to make sure that the sampling rate is below this value a Click on Timing Settings icon Timing Settings window pops up Figure 58 Go to Timing Settings Figure 5...

Page 37: ...he monitoring window pops up Figure 60 Monitoring window b To end monitoring motion click on Stop Monitoring icon 4 6 5 Threshold User needs to define a certain voltage limitation that is convenient to use as a failure indicator This value as was mentioned above is called here threshold By default two thresholds are generated high threshold and low threshold User can add edit and delete threshold ...

Page 38: ...eshold voltage is click on Edit and set value in the Threshold Property window The color of threshold cursor and the condition of threshold can also be set in this window Figure 62 Edit threshold property c After the high threshold voltage has been set the upper cursor appears ...

Page 39: ...hold and low threshold have been set Depending on the input signal type different threshold characteristics can be assigned For example as shown above the optical input signal has to stay within the High and Low threshold margins to be considered as not fail The moment one of the set limits is exceeded the FD ...

Page 40: ...rt of a test responsible for one of the Group failures FD Module contains two types of macros Reboot DUT Macros and Check Failure Macros Both of the macros are necessary because SmartScan software will need to ask FD Module Does failure occur and Reboot DUT Based on the macros FD replies SmartScan yes or no Without check failure macro the DUT will never be reboot since the software will not detect...

Page 41: ...rly to the previous described steps refer to procedure b The Macro scenario consists of a certain command sequence Failure detection macros will be executed when SmartScan needs to know if DUT failed or not and Reboot Macros will be executed when SmartScan needs to reboot and re initialize the DUT In the example shown in Figure 68 rebooting of a DUT has to be done by power cycling If DUT power is ...

Page 42: ...ty of a DUT to reboot and return to its normal operational mode Figure 68 Setup Reboot DUT Macros 4 8 Instrument Settings Make sure FD box and TLP are connected to the computer through USB cables TLP Test Fire a Click on Tools in the top menu bar then select Options Figure 69 Open Options window ...

Page 43: ...Click on Test Fire A message with Discharge is successfully done pops up if connection between SmartScan and TLP is established Figure 70 Test Fire done Measurement Setup a Double click on Instrument Settings in Workspace Explorer pane or double click on Edit instrument settings in Wizard pane Figure 71 Open Instrument Settings window ...

Page 44: ... Test allows user to apply the repetition rate and duration to a TLP while Fire makes the TLP to produce the pulses for setting verification purpose 3 Maximum voltage Minimum voltages and the voltage Increment of TLP for the test can be defined by user The number of steps is calculated based on the parameters entered above 4 Load From Library option allows user to load settings saved previously Ad...

Page 45: ...s trace or IC pins This allows checking for failure after a probe contacts the DUT and reboots the DUT if necessary Percent of previous crash option allows optimization of the scanning time Based on what voltage the previous point crashed instead of dropping to the lowest voltage and re testing a point when a failure is detected the voltage is reduced to some percentage of the maximum test voltage...

Page 46: ...on After the Scanning Task window pops up repeat procedure b to move the project to right window and click on OK The project will then be resumed Figure 76 Resume scanning e If something goes wrong with the existing scan user can always rescan a project Select the project on right window click on the red flag The action of the project will be changed to Rescan Click on OK to rescan the project ...

Page 47: ...ta displayed in the graph shows the magnitude of measured signal at each frequency in a selected range By selecting a specific frequency using the scroll bar the pattern of radiation for any selected frequency is then displayed on the highlighted area 1 The highlighted area indicated by a 3 is the legend chart shows how the software illustrates the super imposed plot s readings of the field measur...

Page 48: ...nd Surface In Points mode the amplitude at a single probing position is represented by a discret dot with a specific color While in surface mode the amplitude of emission is displayed in a single plane that forms a continuous surface with a smooth variation of colors over the scan area Colors range from blue the lowest amplitude to red which represents the highest amplitude of emission Figure 79 S...

Page 49: ... 5 1 2 Show Plot as 3D SmartScan software displays the scan results in 2D as default 3D plots can be displayed by selecting the option Show plot as 3D in 3D Plot Options list as shown in Figure 81 Figure 81 Show plot as 3D Figure 82 Data display in 2D left and 3D right ...

Page 50: ...to select and click left mouse button A white cross symbol indicates the point that user selected The graph below the color map shows the frequency response of that selected point An example is shown in Figure 84 Figure 84 Pick a point example Move is used to move the DUT picture Click left mouse button on any location of DUT picture window drag the picture to a desired location then release the m...

Page 51: ...y for Rotate function is keep pressing the Ctrl Shift key on the keyboard and move the mouse Figure 86 Rotate DUT picture example Zoom is used to zoom in the DUT picture Place and click the left mouse button on any location of the DUT picture window drag the mouse from top towards bottom to zoom in the picture or drag from bottom towards top to zoom out the picture The shortcut key for Zoom functi...

Page 52: ...k option displays the peak point on the color map The scan point with maximum amplitude among all other scan points is selected as peak point at each frequency As user moving the scroll bar to change the frequency cursor the peak points shown on the color map changes simultaneously Figure 89 Show peak example Show grid functiondisplays the grid on top of the scan results X scale and Y scale indica...

Page 53: ...elected points When placing the mouse pointer above scanned points the graph below the color map updates each point s frequency response When enable Show value on legend function along with Track point function the magnitude of chosen point at a selected frequency is shown in the legend chart Figure 91 Track point example ...

Page 54: ...To change transparency of data plots over the background DUT picture the user can adjust the Transparency scroll bar An example of a surface with enhanced transparency is shown inFigure 93 Figure 93 Change transparency of data plots 5 2 Data Visualization Options 5 2 1 3D Plot Display Options ...

Page 55: ...hold per Point displays a color map that contains the maximum amplitude of each scanned point regardless of frequencies This color map does not change as the user changes the frequency cursor Minhold per Point displays a color map that contains the minimum amplitude of each scanned point regardless of frequencies This color map does not change as the user changes the frequency cursor Average per P...

Page 56: ... in a way that the scale of the color map sorted from the minimum amplitude collected among entire frequency rangeto the maximum amplitude collected among entire frequency range Custom mode allows the user to enter the minimum and maximum values of magnitude in order to focus on a specific range An example of three color maps displaying in three different options is shown in Figure 96 All other se...

Page 57: ...the scroll bar moves from left to right the data plot appears from the bottom to top in Z direction Check Flipped to reverse the data plot appear direction Figure 98 XOY cut plane option XOZ When XOZ is enabled as the scroll bar moves from left to right the data plot appears from front to back in Y direction Check Flipped to reverse the data plot appear direction Figure 99 XOZ cut plane option ...

Page 58: ...on 5 4 Data Selection The user can define which components of the field are displayed in the graphics area by selecting the X_Component or Y_Component in the workspace explorer under the Project name shown in Figure 101 Figure 101 Select components The magnitude can be displayed by opening the Merge Data window which can be accessed through the Post Processing button on the top menu bar of the Sma...

Page 59: ...ure 102 Merge data Figure 103 Merge data window By selecting the scanned X component and Y component and naming the data set the user will find a new data set which contains the magnitude of the scanned field ...

Page 60: ...ould have to rotate and perform a continuous measurement through a 90 degree angle ensure an accurate reading The scara type robots used in the SmartScan technology can only rotate the shaft the probe is connected too in finite steps so continuous measurement is not possible Additionally the X and Y magnitude arrows will always point in the positive direction as SmartScan measures only the scalar ...

Page 61: ... the frequency response graph Figure 106 Peak search option Figure 107 Show maximum scan value Figure 108 Move cursor to maximum frequency Figure 109 Track cursor Figure 110 Track cursor for peaks Figure 111 Define peak threshold and excursion in peak search options ...

Page 62: ...ons These options facilitate rapid data transfer to ASCII format which later can be sent to any data analysis software such as MATLAB The Export Current View function compiles a data sheet containing the measured data set that corresponds with the visualized data being currently displayed on the graphics area as shown in Figure 115 Figure 115 Export current view ...

Page 63: ...63 The Export Curve function compiles data related only to the 2D frequency plot highlighted by red box shown in Figure 116 Figure 116 Export curve ...

Page 64: ...Stitching is used for large DUTs when whole scan area cannot fit in one screen shot Click on Stitching button highlighted by the red box shown in Figure 117 select a stitching area give the DUT height and click on OK Figure 117 Stitching function Figure 118 Select stitching area Figure 119 Stitching height ...

Page 65: ...an area cannot fit in one screen shot is to take a picture of DUT by external camera and import the DUT image Click on Import Picture button highlighted by the red box shown in Figure 121 choose the picture to import define picture height and click on OK Figure 121 Import picture ...

Page 66: ...re 123 decide the first reference point on the imported picture and click left mouse button in the picture the define position window pops up click on Robot Control move robot to the first reference point click on Get From Robot and OK to save the first reference point position Decide the second reference point on the imported picture and click left mouse button in the picture the define position ...

Page 67: ...67 Figure 124 Define first reference point Figure 125 Move robot to first reference point Figure 126 Record first reference point position 1 ...

Page 68: ...68 Figure 127 Define second reference point Figure 128 Record second reference point position The imported picture position definition is completed at this point 1 2 ...

Page 69: ...69 Figure 129 Picture position definition completed ...

Reviews: