©York Survey Supply Centre 2018
Ref:.. \operat98\instructions 18\33405.qxp 05-01-18
4
5
successful.
Remote Rain Gauge Transmitter
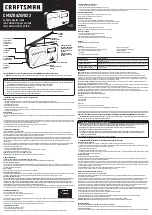
1. Open the outer case of the rain gauge.
(See diagram)
2. Remove the tape from the bucket inside so it
moves freely.
3. Batteries are already installed in the rain gauge.
Remove the inner cover to access the RESET/
RE-SYNC buttons. Pressing the RESET button,
the rain gauge RF (radio frequency) signal is
immediately sent to the clock. The rain gauge
window on the main unit will display “
0
”, showing
the reception was successful.
4. If the rain gauge signal is not received within five
attempts, “
---
” appears in the rain gauge window of
the clock. In this case, press the RE-SYNC button
of the main unit, then press RE-SYNC button at
the back of the transmitter. The clock then
attempts rainfall reception for another six minutes.
5. If the clock does not display the rain gauge data
after six minutes, relocate the clock or the rain
gauge until reception is successful.
6. Mount the rain gauge on a level surface (use metal
ring to adjust the levelling of the rain gauge).
7. Close the outer case. The installation of the rain
gauge is completed.
Synchronisation of Remote Units and Main Unit
1. After the batteries have been inserted in the main
unit and in the remote transmitter unit, the LCD on
the remote should show current temperature/
humidity. In a few minutes, the remote
temperature/humidity/rainfall are shown in the
outside temperature/humidity/rainfall field on the
main unit. If at least ten minutes pass and the
outside temperature/humidity/rainfall field displays
“
---
” instead of the remote unit’s temperature/
humidity/rainfall, see the “Transmission
Troubleshooting” section. Be sure the main unit
and transmitter units are in sync and the outdoor
temperature/humidity/rainfall are displayed on the
main unit.
2. After a few minutes, place the remote transmitter
unit in the desired outdoor location within 100 feet
maximum of the main unit. Place the main unit as
close as possible to the outdoor remote unit. For
best results, the remote unit should be placed
within sight of the main unit, such as outside the
closest window. If necessary, screw the included
wall-mount bracket to a convenient outdoor
location and place the transmitter unit inside the
bracket. The remote/outdoor temperature/
humidity/rainfall will be shown on the main unit.
Obstacles, walls, etc. reduce the range
significantly. The transmitter should be placed
where it will not experience weather extremes,
such as rain, snow, direct sunlight, etc. This allows
you to receive an accurate outside temperature/
humidity/rainfall reading and weather forecast.
Note: For more details on synchronization, please
refer to “Wireless Remote Temperature
Transmission”.
Weather Forecast
The local weather forecast and weather tendency are
predicted using the rate of change in atmospheric
pressure determined by a precisely calibrated
pressure sensor. After turning the unit on for the first
time, it takes 24 hours for the weather forecasting
data to be calculated for the first time. After 24 hours,
the unit calculates the weather for the next 6 hours.
To ensure a reliable weather calculation, do not
relocate the unit during operation. Weather tendency
is indicated by an up or down forecast arrow.
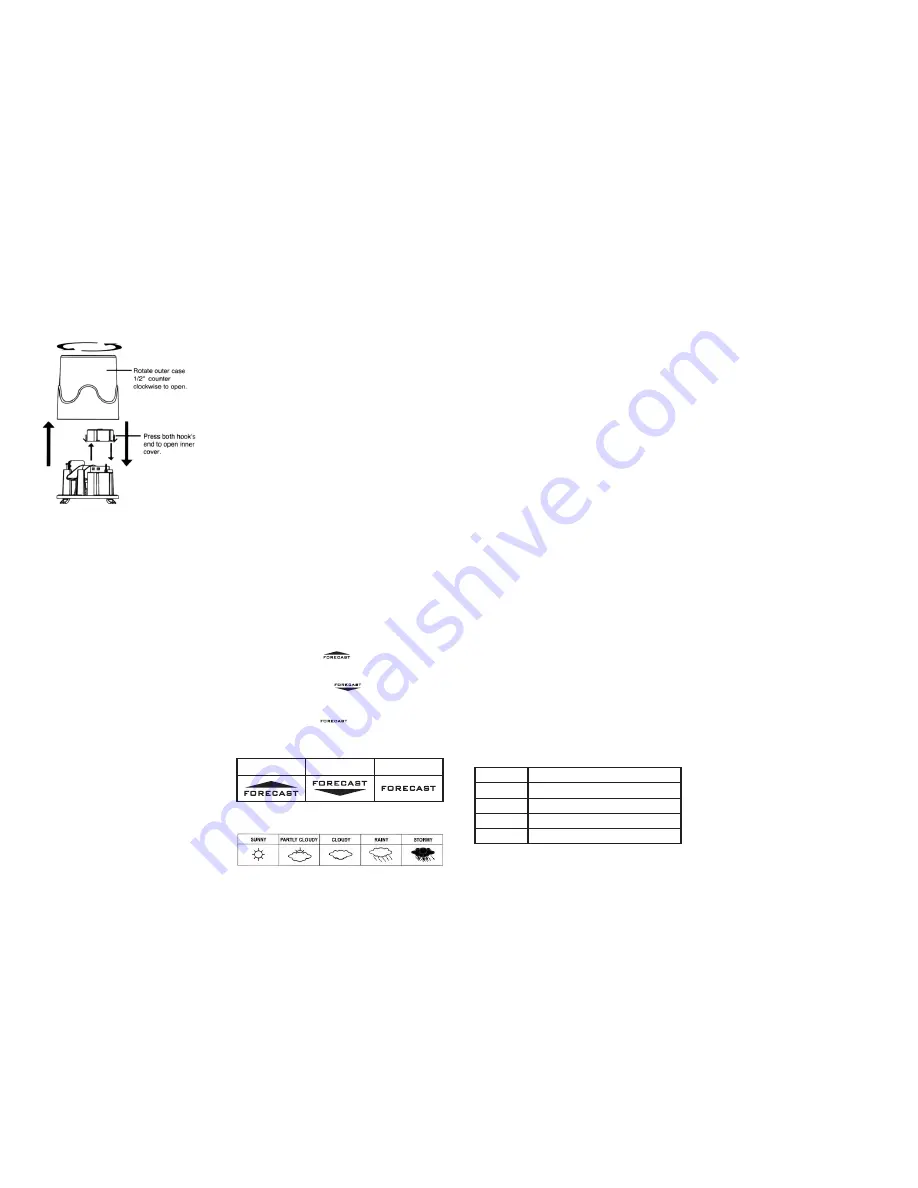
1. The up arrow icon (
) indicates a significant
increase in atmospheric pressure. This normally
means the weather is going to improve.
2. The down arrow icon (
) indicates a
significant decrease in atmospheric pressure. This
means the weather is going to get worse.
3. The forecast icon (
) without an arrow
indicates a steady/insignificant change of
atmospheric pressure. This means the weather will
remain unchanged.
Weather Conditions
The current weather condition is displayed using one
of five animated icons. Sunny, Partly Cloudy, Cloudy,
Rainy or Stormy. The stormy icon only appears when
a sudden and serious drop in atmospheric pressure
is detected.
Barometric Graph
1. The barometric graph shows the previous day’s
pressure changes. The Time Axis shows the
changes from the previous day, e.g. 4 = 4:00am,
8 = 8:00am, 12 = 12:00pm, 16 = 4:00pm,
20 = 8:00pm and 24 = 12:00am
2. The unit stores the pressure mean of the previous
day from 12:00am to 11:59pm
3. The barometric graph shows the pressure
difference between the pressure at the time
(4:00am, 8:00am, 12:00pm, 4:00pm, 8:00pm and
12:00pm) and the mean pressure.
4. If the pressure difference exceeds ±6mb
(millibars), then the barometric graph shows the
±6mb.
5. The barometric graph resets if there is a change to
the time zone, Daylight Saving Time, or day setting
(manual or radio controlled). The barometric graph
resets if the clock setting (manual or radio
controlled) deviation is larger than ± half an hour.
Barometer
1. Current: Shows the current Pressure Reading,
refreshes every 4 seconds.
2. Daily Total: Press the HISTORY button and the
average pressure of the last day will be displayed.
This display is updated every day at 12:00am.
3. Weekly Total: Press the HISTORY button and the
average pressure of the last week will be
displayed. This display is updated every Sunday
at 12:00am.
4. Monthly Total: Press the HISTORY button and
the average pressure of the last month will be
displayed. This display is updated 1st of each
month at 12:00am.
5. Season Total: Press the HISTORY button and the
average pressure of the last season (1st season:
1st Jan, 2nd season: 1st April, 3rd season: 1st
July, 4th season: 1st October) will be displayed.
This display is updated at the starting day of each
season at 12:00am.
6. The Barometer is reset if the clock is set manually
and day setting deviation is larger than ± half an
hour.
Outdoor Rainfall
1. Current: Shows the current rainfall.
2. Daily Total: Press the HISTORY button and the
average rainfall of the last day will be displayed.
This display is updated every day at 12:00am.
3. Weekly Total: Press the HISTORY button and the
average rainfall of the last week will be displayed.
This display is updated every Sunday at 12:00am.
4. Monthly Total: Press the HISTORY button and the
average rainfall of the last month will be displayed.
This display is updated 1st of each month at
12:00am.
5. Season Total: Press the HISTORY button and the
average rainfall of the last season (1st season: 1st
Jan, 2nd season: 1st April, 3rd season: 1st July,
4th season: 1st October) will be displayed. This
display is updated at the starting day of each
season at 12:00am.
6. The Rain Gauge is reset if the clock is set
manually and day setting deviation is larger than
± half an hour.
Barometer and Rainfall History
1. Pressing the HISTORY button to see the history of
mean Barometer and total Rainfall for the current
day, week, month and quarter (season). The
display sequence is: (current) - daily - weekly -
monthly - quarterly - (current)
2. Current Barometer and Rain rate will display after
five seconds.
3. Press the CLEAR button when mean Barometer
and total Rainfall are displayed to clear all data.
Units Setting
1. Barometer: press PRESSURE UNIT button, the
unit can select units of mb, inHg, mmHg or hPa.
2. Rainfall: press RAINFALL UNIT button, the unit
can select units of in/hr or mm/hr
Indoor and Outdoor/Remote
Temperature/Humidity Readout
1. The indoor and outdoor temperatures can be
displayed in either °F or °C. The main unit converts
the temperature if the remote transmitter unit is set
to a different temperature display. If the
temperature and/or humidity exceeds or falls below
the unit’s range, the display shows either “HI” or
“LO” in place of the temperature and/or humidity.
2. To display the recorded minimum and maximum
indoor and outdoor temperatures/humidity in
succession, press the MAX/MIN button on the
main unit repeatedly. The temperature/humidity
display returns to the current temperature after five
seconds or after pressing the MAX/MIN button
three times. To clear the maximum and minimum
temperature/humidity data, press the CLEAR
button whilst the maximum and minimum
Tendency - Up
Tendency - Down Tendency - Steady
Seasons
Range
Season 1
January 1 through March 31
Season 2
April 1 through June 31
Season 3
July 1 through September 31
Season 4
October 1 through December 31